2023 Hotel Online Distribution Trends: Europe & Asia
Drawing insights from 2019 – 2023 data to guide 2023 hospitality marketing & revenue strategies
The Hotel Online Distribution Trends Report is an annual analysis of traveller online booking behaviour from D-EDGE Hospitality Solutions. This year’s report is based on data collected from 4,594 properties in Europe and 524 properties in Asia (excluding mainland China) comprising independent hotels and small to medium-sized hotel groups from 2019 through 2022, along with a preview of 2023 data.
A tale of two continents: while hotel recovery nears peak in Europe, it’s just beginning in Asia
Driven by robust leisure demand and rapid rate growth, in 2022 the global hotel industry almost fully recovered from the pandemic downturn. However, there was one major exception: Asia.
According to STR, in 2022 hotels in Europe grew their average daily rate (ADR) by 18.5% relative to 2019 and revenue per available room (RevPAR) by 6.1%, whereas occupancy lagged by 10.5%. Meanwhile, in Asia, where travel restrictions remained in place long after being lifted in other regions, ADR fell 9.9% short of 2019 levels, RevPAR was down 31.2% and occupancy was down 23.7%. Nevertheless, Asia is poised for a sharp rebound in 2023.
In this report, we draw from our data set of independent hotels and small to medium-sized hotel groups in Europe and Asia to analyse distribution trends from four years of online booking data spanning from 2019 through 2022. We also provide a peek at 2023 booking trends with a look at January data.
We break down performance by key distribution metrics, including gross and average booking revenue, average rate, length of stay, channel market share, cancellation rates and lead times. And we share strategies for leveraging shifting travel patterns to grow revenue and outperform competitors in 2023.
In the following sections, we look at booking value (revenue), which provides greater insight into hotel performance than the volume of bookings or room nights.
Key Findings
Before we wade into the data, here are the highlights from our analysis.
- In 2022, gross booking revenue was up 49% in Europe relative to 2019.
- The average daily rate (ADR) in Europe soared 25% above 2019 levels in 2022 and increased by 6% in Asia.
- After gaining substantial market share from OTAs during the pandemic, hotel direct booking revenue lost some ground in 2022 but still managed to hold on to increases of 5 points in Europe and 19 points in Asia relative to 2019.
- Booking Holdings maintained its dominant market share of OTA bookings in 2022 but generated the lowest average length of stay and the highest cancellation rate of the major online booking channels.
- Expedia Group has lost significant market share in both Europe and Asia, but volume is expected to pick up in 2023 as international travel gains momentum.
- After spiking during the pandemic, cancellation rates returned to near-normal levels in 2022.
- Data from January 2023 shows a promising start to the year, with significant increases in average booking value, ADR and length of stay in both regions.
Definitions: Key Hotel Distribution Metrics
Here’s a quick reference guide to the key metrics in this report:
- Gross booking value (GBV): Total revenue from all online booking channels, fewer cancellations.
- Average booking value (ABV): The average amount guests pay per online booking, also called average transaction price (ATP). It is calculated by multiplying the average daily rate by the average length of stay.
- Average daily rate (ADR): The average price guests pay for a room per night.
- Average length of stay (ALOS): The average number of nights guests stay per booking.
- Lead time: The average number of days prior to the arrival date that guests make bookings. This can also be referred to as “booking window”.
- Direct channel: Direct bookings made through hotel brand websites.
- OTA channel: Bookings made through online travel agencies.
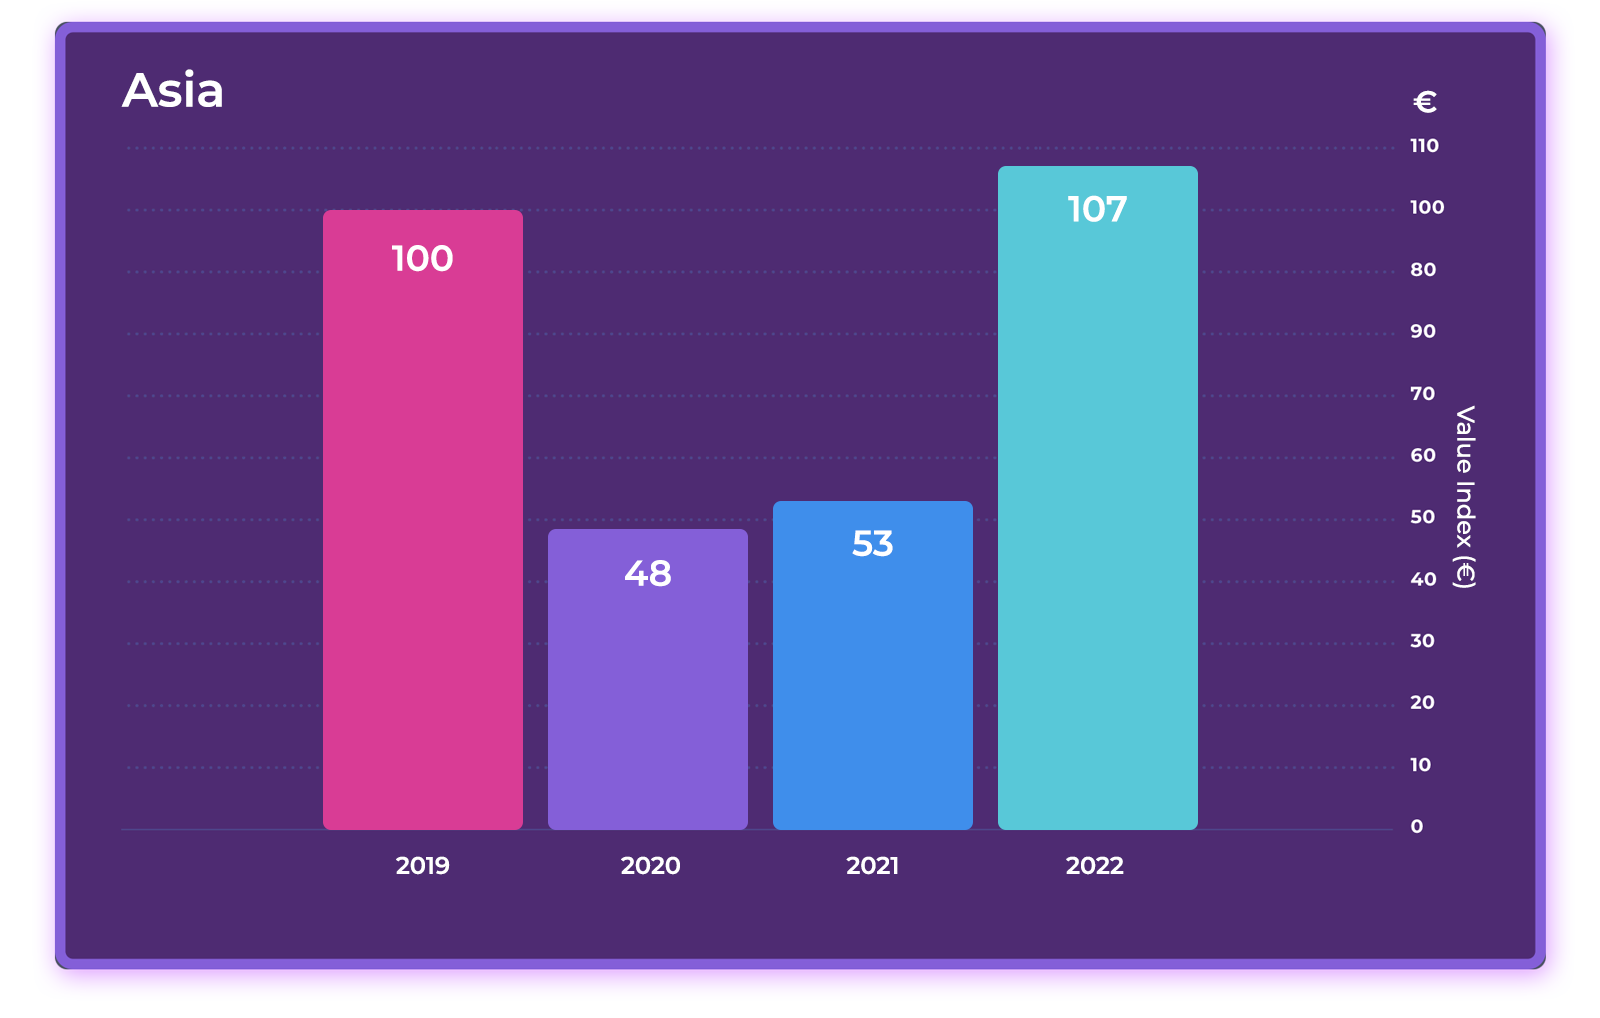
Gross Booking Value: Hotels in Europe and Asia Surpass 2019 Levels
Gross Booking Value (GBV) – Indexed to 2019
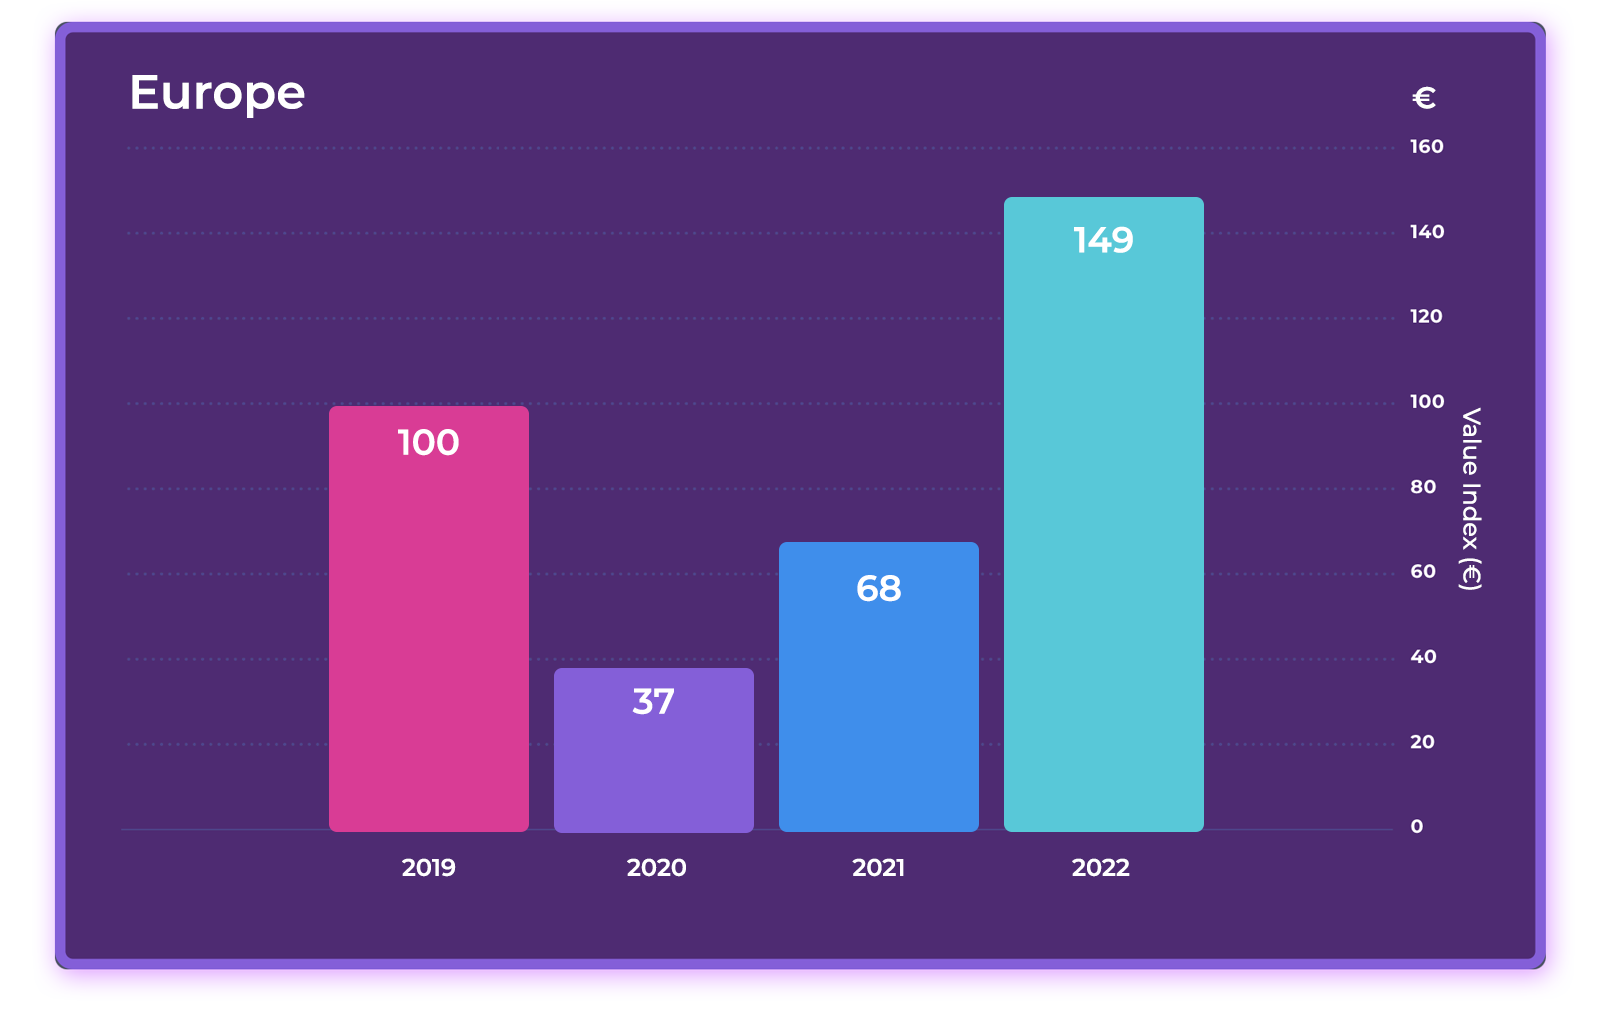
In Europe, the pace of recovery experienced a setback in the first quarter of 2022 after the Omicron variant hit, but by mid-year most travel restrictions had been lifted. A boom in leisure travel followed and was supplemented by growing demand for business travel to end the year with a strong finish. Overall, hotels in our data set in Europe clocked an impressive 49% growth in gross booking value (GBV) relative to 2019.
In Asia, recovery in 2022 was held back by continued travel restrictions, which remained in place in China and select countries. Only in the second half of the year did restrictions begin to ease. However, the last holdout was China, which historically accounts for a significant proportion of outbound tourists in the Asia Pacific region. By the time China reopened its borders in January 2023, it was too late to save 2022. Nevertheless, hotels in our data set managed to surpass already gross booking value by 7% in 2022 compared to 2019, outperforming the broader market.
2023 Marketing & Revenue Strategies: Target Emerging Travel Segments
In 2022, the rebound was driven primarily by leisure demand. In 2023, continued strong leisure demand is expected to be accompanied by growth in the international, business and group segments. However, a possible economic slowdown, ongoing inflationary pressures, a renewed pandemic outbreak or another disruptive force may slow down the pace of growth.
Hoteliers should pay close attention to the segments in growth mode:
- International travellers. In 2022, Europe recaptured nearly 80% of the pre-pandemic volume in international tourist arrivals, whereas Asia reached only 23%, according to the UNWTO. This year, Europe is forecasted to fully recover, bolstered in part by strong demand from the US. In Asia, a strong rebound is anticipated but is less certain due to the region’s high dependency on China, the world’s largest outbound market in 2019.
- Business travellers. In 2023, Europe is forecasted to be the fastest-growing business travel market in the world, increasing travel spend by 25.3% over 2022, according to the GBTA. In Asia, a strong rebound in business travel may be tempered by restrictions on Chinese travellers in some countries.
- Group business. According to Amex’s 2023 Global Meetings and Events Forecast, in-person meetings and events are roaring back, with internal and small meetings already surpassing 2019 levels in some regions. With more companies operating with remote workforces, the need to bring employees together has never been greater, reports Amex. However, group lead times are 25% shorter on average than in 2019.
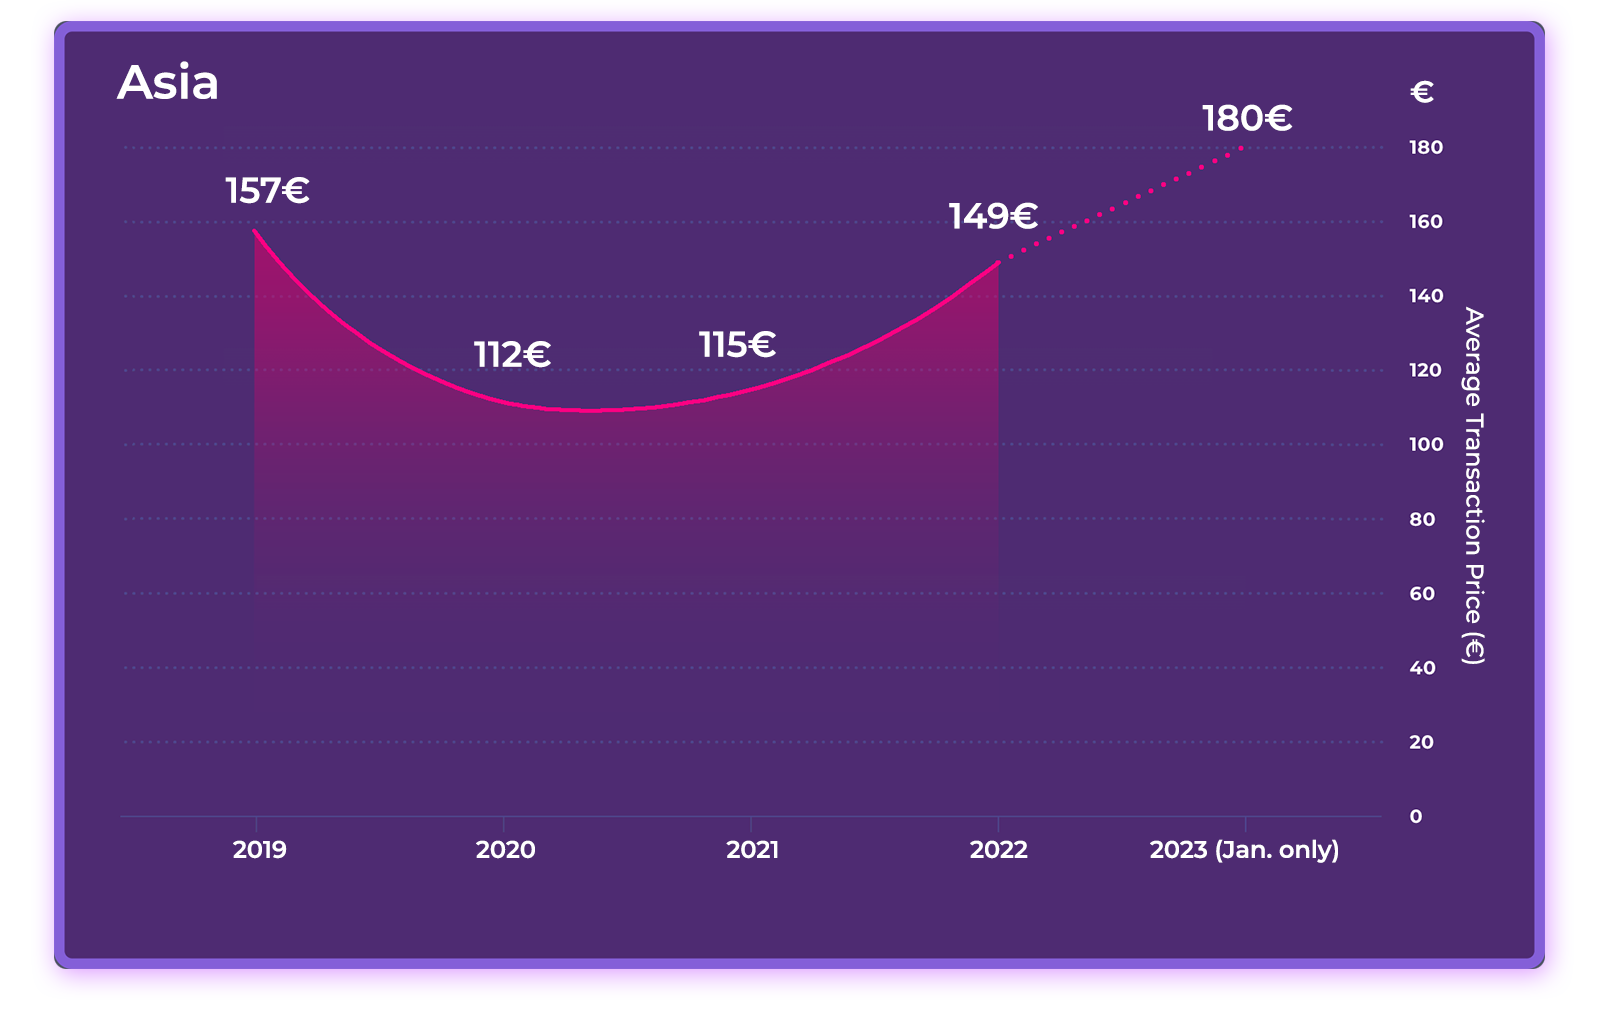
Average Booking Value: Europe Surges Past 2019 Numbers While Asia Struggles to Catch Up
Average Booking Value (ABV) in €
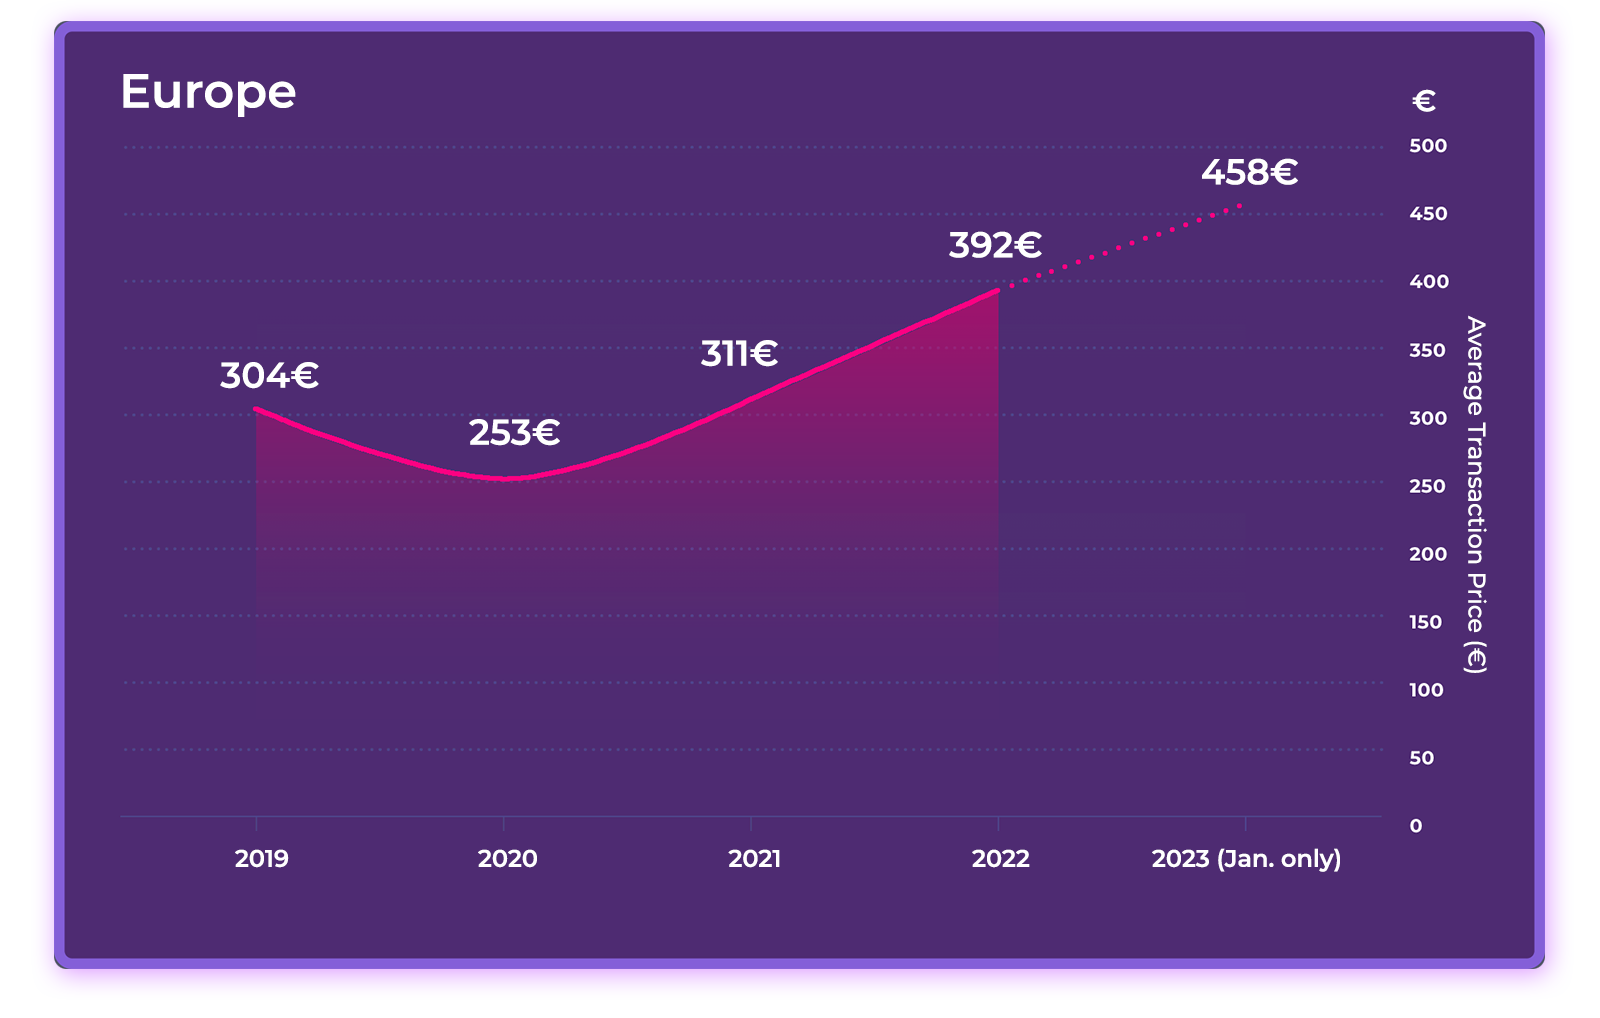
Generally, room rates are much higher in Europe than in Asia, so it’s no surprise that average booking value (ABV) is also significantly higher. After dropping by 17% from 2019 to 2020, in 2022 hotels exceeded 2019 levels by 29%. Taking a sneak preview of our 2023 data, we see that the rapid growth trajectory in Europe continued in January, reaching a peak of €458.
In Asia, average booking value followed a similar path, although the pace of recovery was weaker. By 2022, ABV fell just 5% short of 2019 levels. However, in January 2023 the pace of growth gained momentum, exceeding pre-pandemic ABV by 15%.
Average Booking Value (ABV) in € by Hotel Category
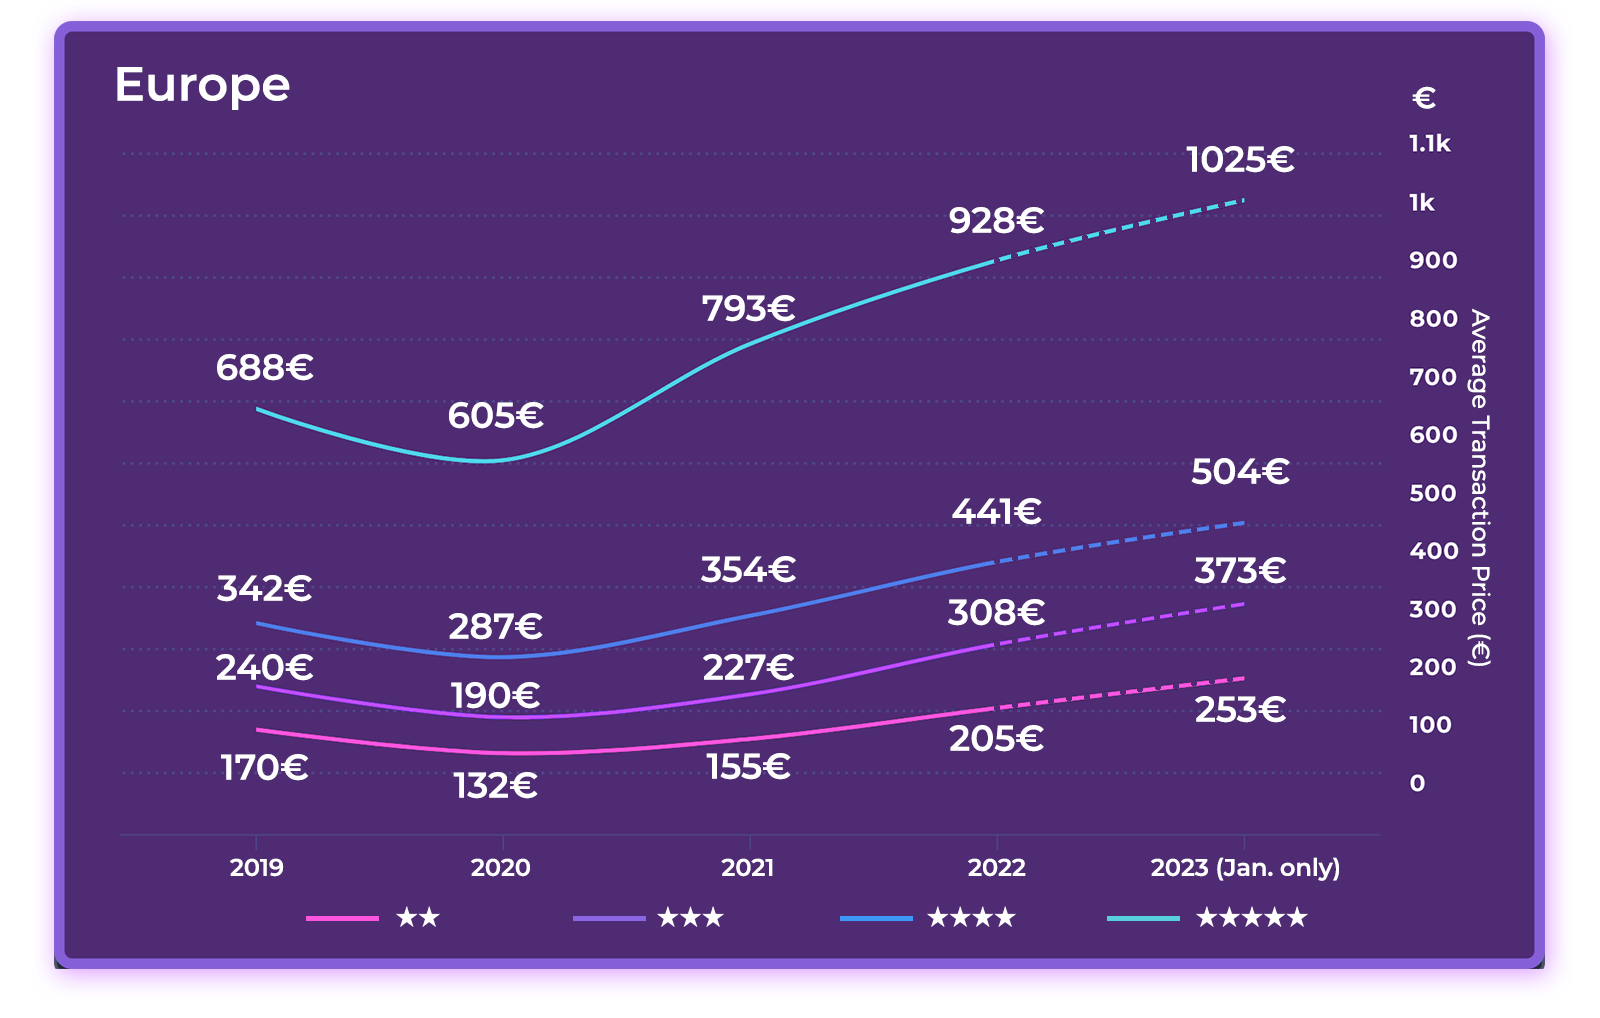
In 2020, we witnessed that the higher the average booking value climbs, the harder it falls, with 4 and 5-star hotels declining sharply on both continents. In 2022, however, the rebound was sharp in the upper segments, widening the gaps between lower segments. And in January 2023, 5-star hotels broke the €1,000 barrier in ABV, an increase of 49% over 2019 levels.
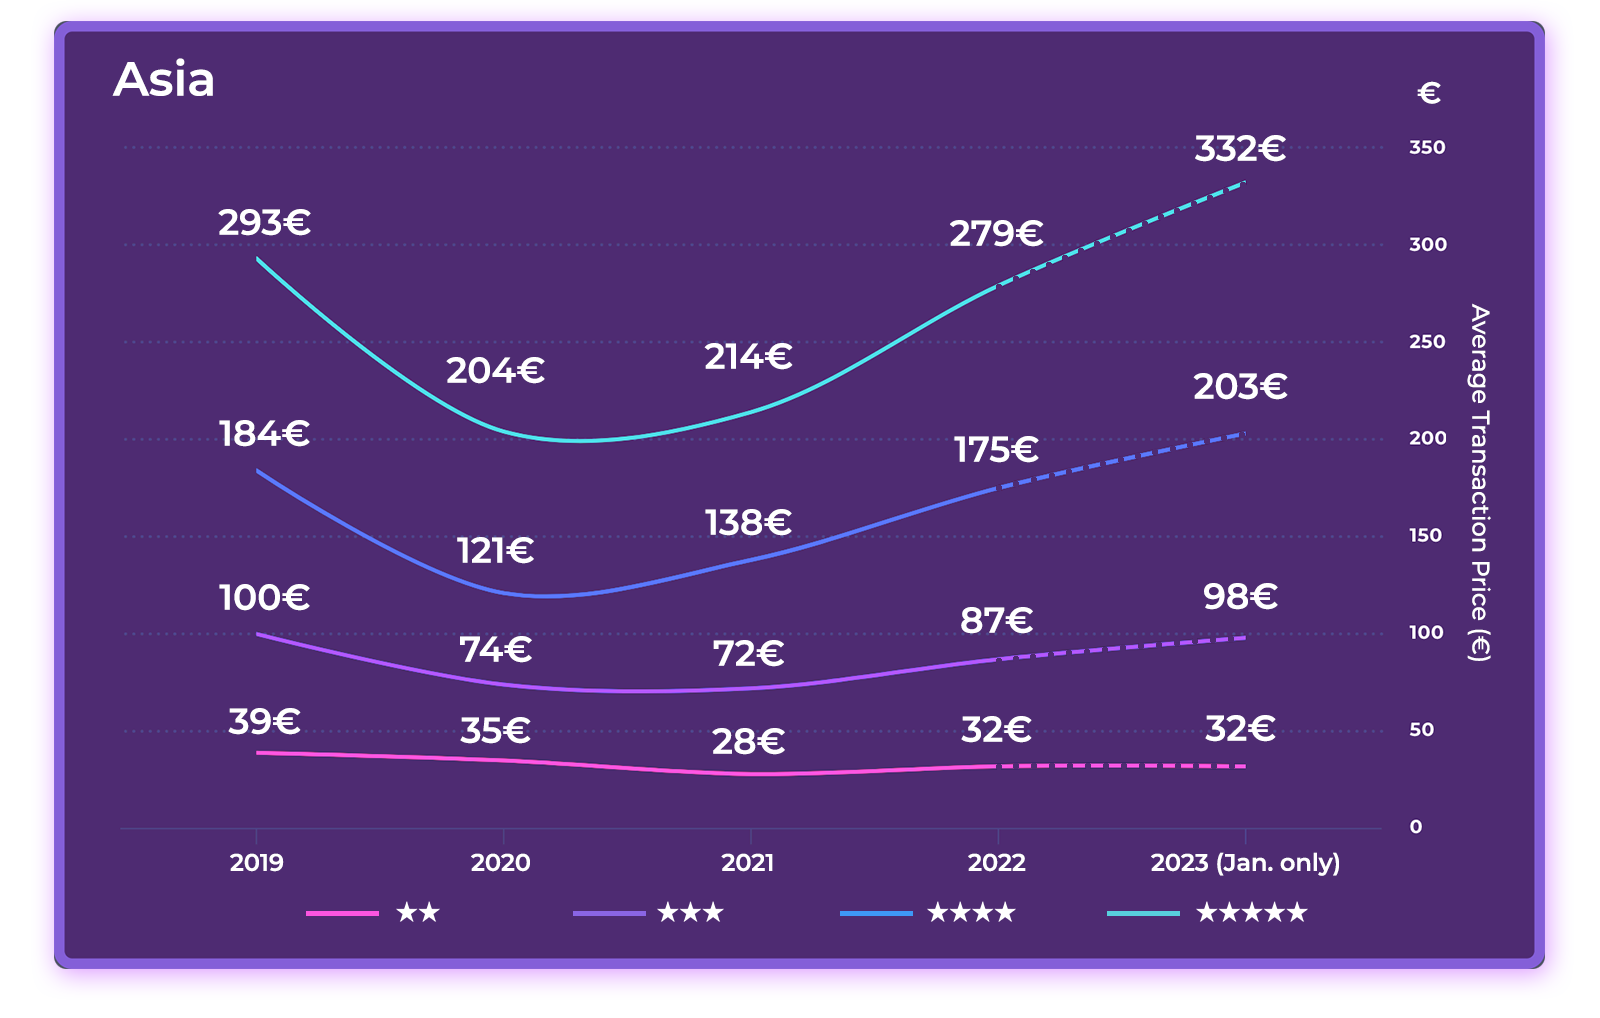
In Asia, a substantial increase in January 2023 pushed ABV well above 2019 levels for 4 and 5-star hotels and just below 2019 levels for 2 and 3-star hotels—a promising sign of the potential growth to come this year.
Average Booking Value (ABV) in € by Online Sales Channel
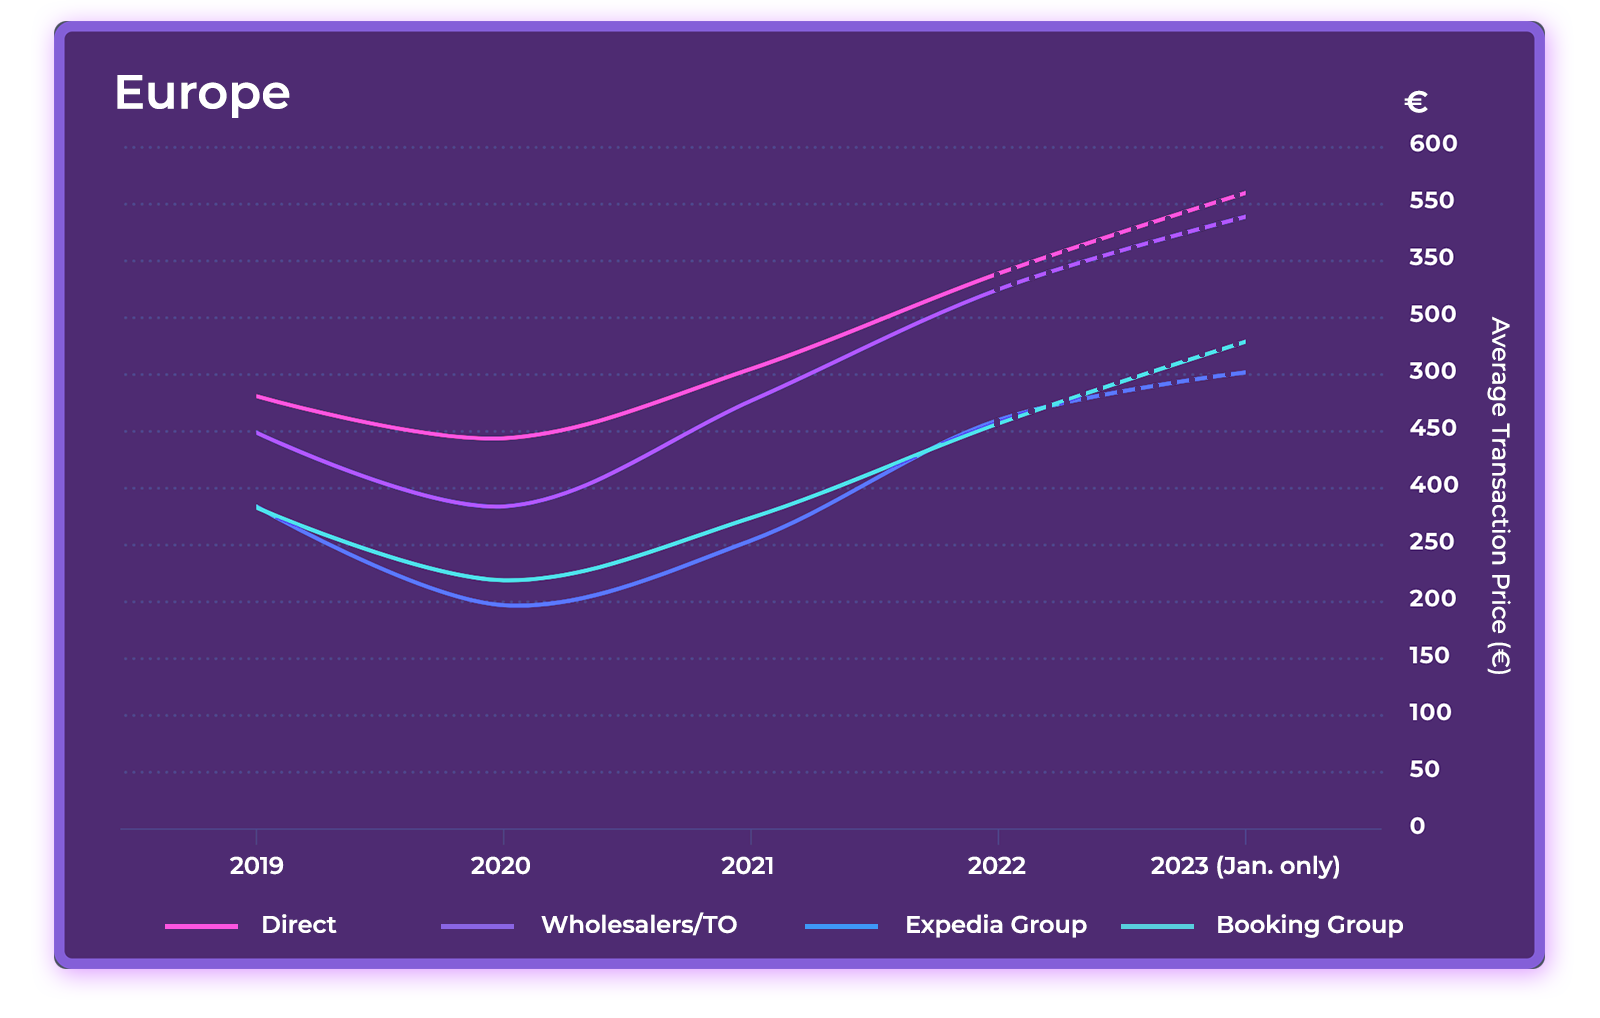
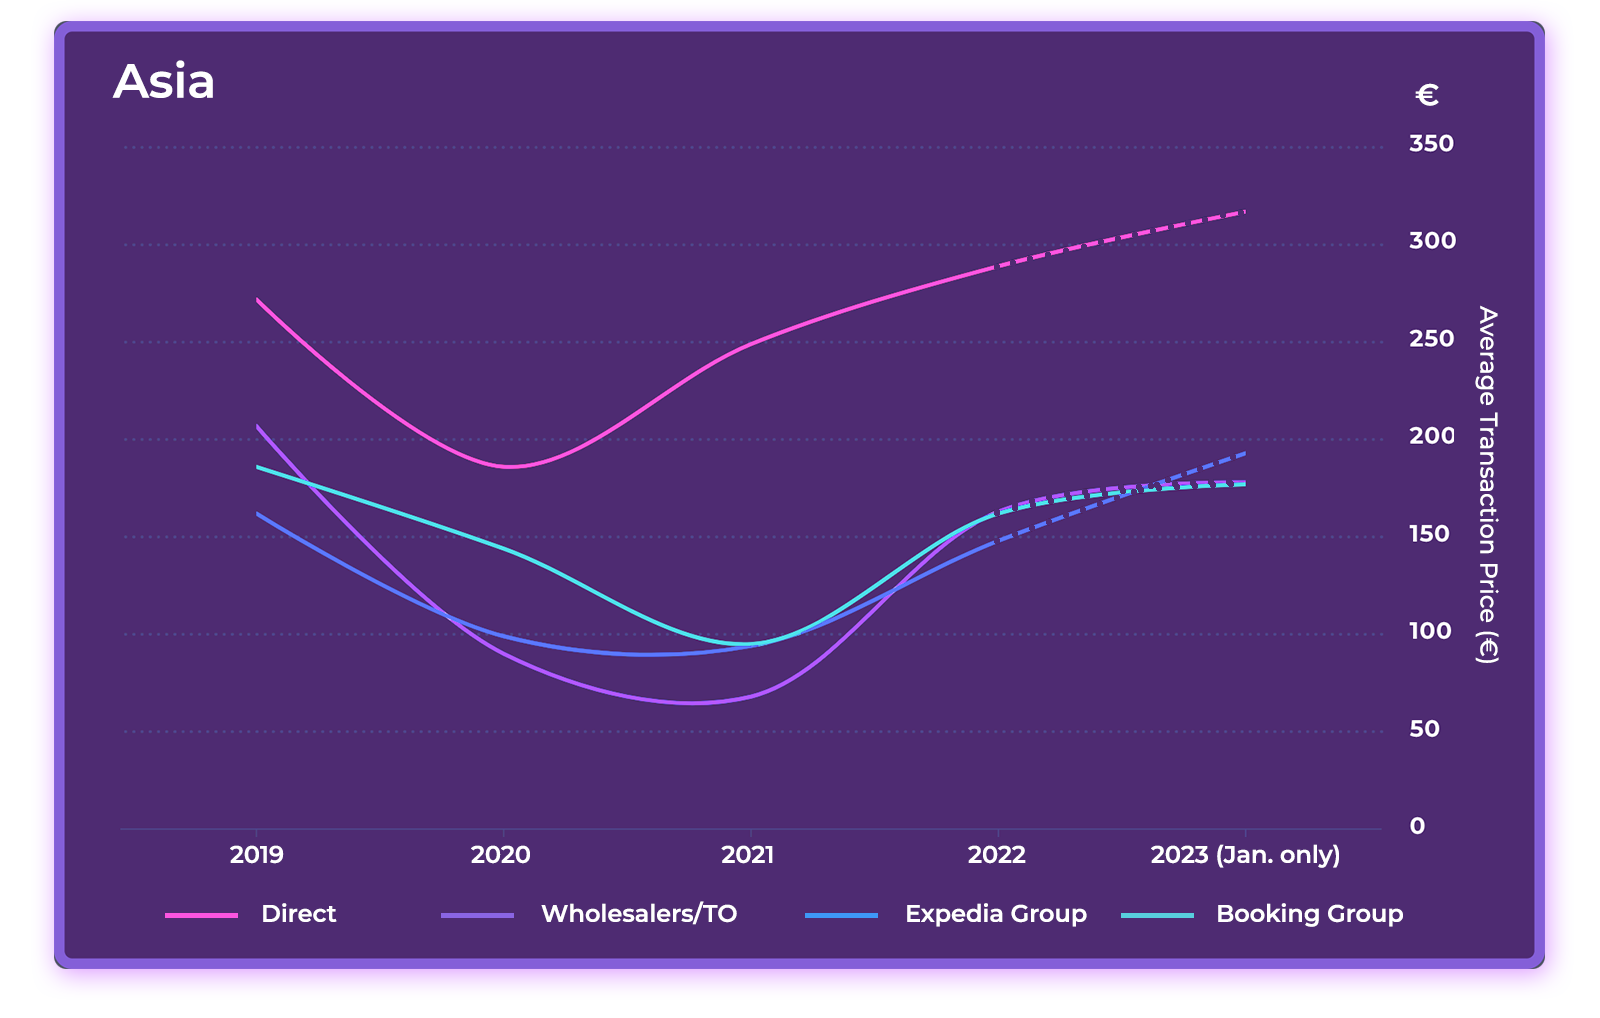
How does average booking value compare across distribution channels? Here we see that the direct channel generated the highest ABV on both continents in all four years of the study. In Europe, OTAs operated by Expedia Group and Booking Holdings generated the lowest ATP, whereas in Asia, the lowest ATP came from Booking Holdings and wholesalers.
Average Daily Rate: Pricing Discipline Is Paying Off
Average Daily Rate (ADR) in €
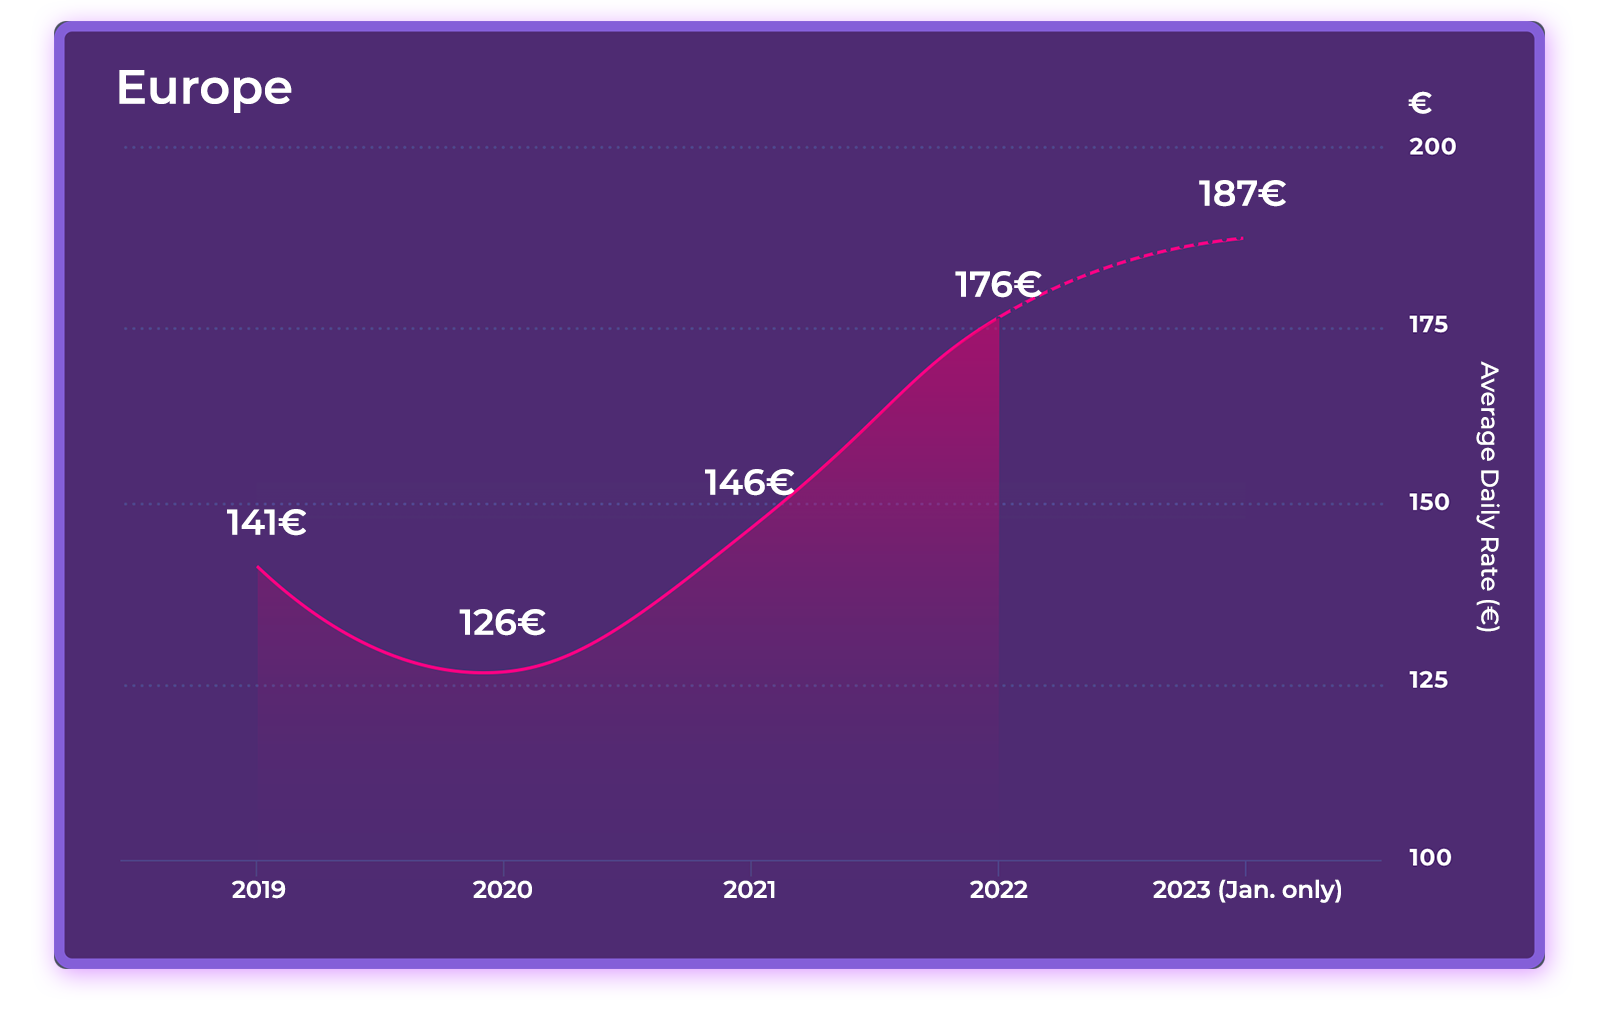
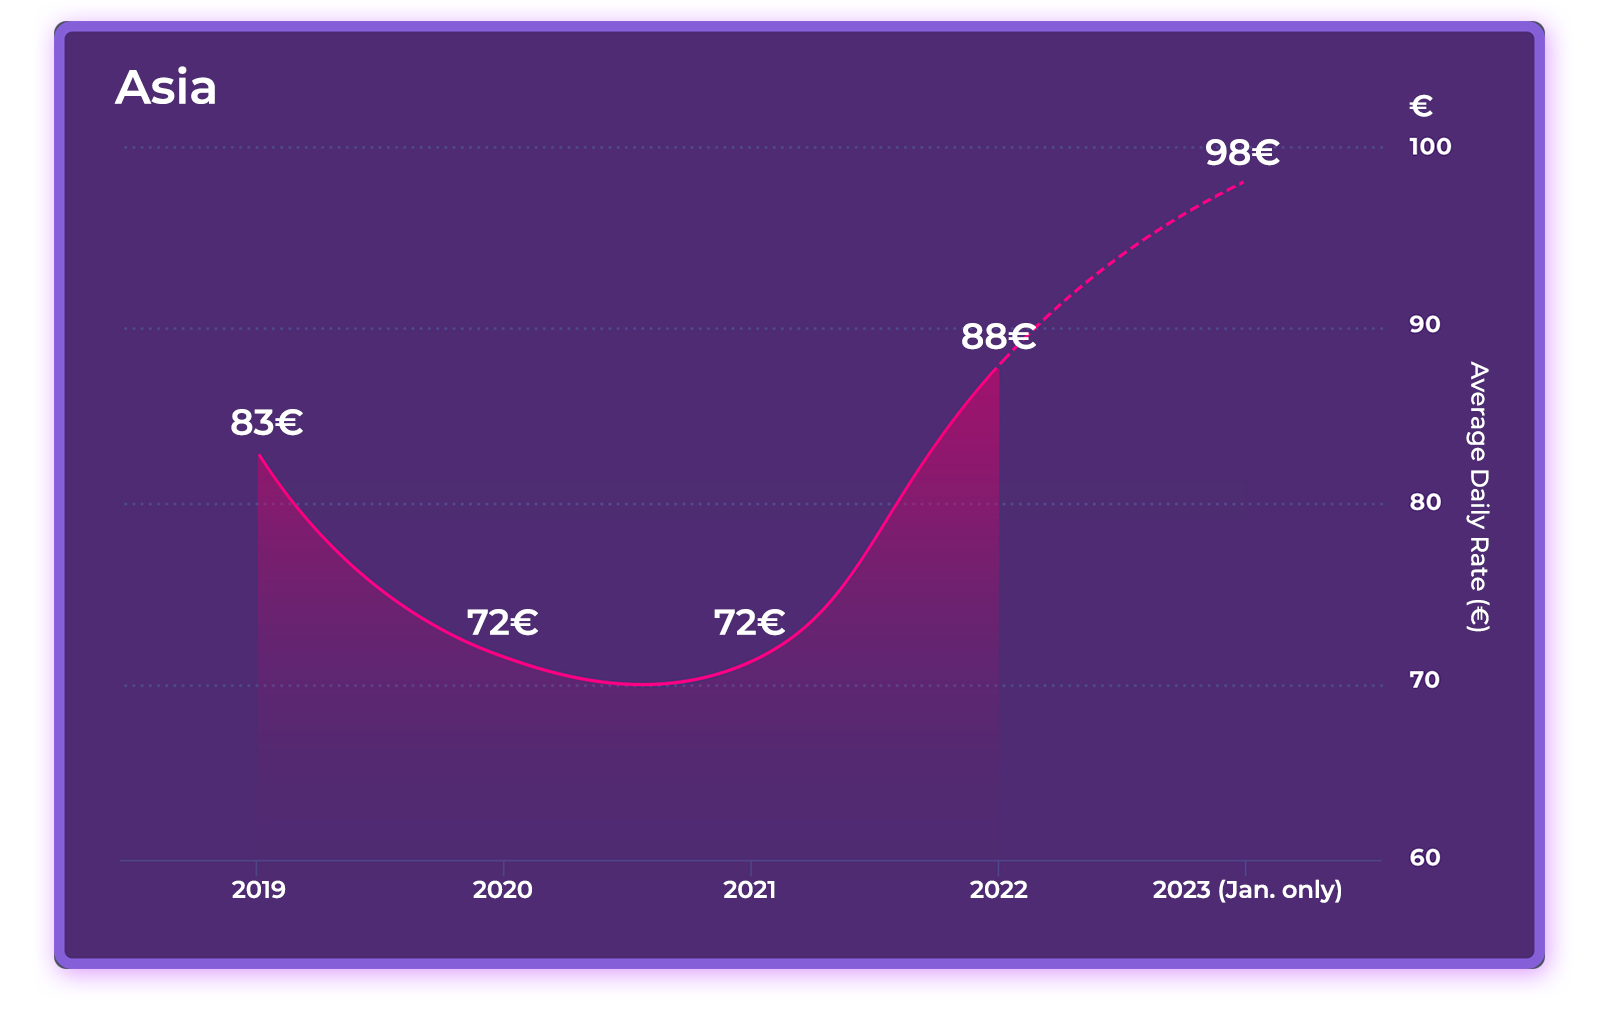
Unlike in previous downturns, during the pandemic room rates were a key driver of recovery. Hoteliers showed remarkable discipline in holding rates despite a sharp downturn in demand. The strategy has paid off, softening the impact of low occupancy rates and high operating costs and pushing ADR above 2019 levels.
In Europe, the results were astonishing. In 2022, hotels in our data set exceeded 2019 ADR by 25%. In Asia, despite continued low demand, hotels managed to increase ADR by 6%. In January 2023, we see that ADR grew by an additional 6% in Europe and by 11% in Asia over 2022 levels.
2023 Marketing & Revenue Strategies: Find Revenue Growth with Targeted Pricing, Premium Inventory and Ancillary Products
It’s important to note that rate growth relative to 2019 is much less impressive when adjusted for inflation. Hotels are commanding higher rates but paying more in distribution, labour and operating costs. This year, there will be intense pressure to grow revenue and profitability while containing costs.
However, with inflated pricing and fears of an economic downturn in the air, travellers are expected to show greater price sensitivity. Many will look for ways to tighten travel budgets by taking shorter trips, staying closer to home, downsizing hotel categories or seeking special deals and discounts.
Nevertheless, with the right strategies in place, independent hotels and small to medium-sized hotel groups are well-positioned to flex their pricing power. While branded hotels generally enjoy higher occupancy rates, independent hotels command higher ADR and RevPAR, according to research published in the International Journal of Hospitality Management. Substantial rate increases by the big global hotel brands in Q4 2022 suggest that ADR has not yet hit a ceiling in Europe, whereas the Asia Pacific region is poised for substantial rate growth in 2023.
In addition to maintaining a dynamic pricing strategy and increasing rooms rates where feasible, here are some pricing strategies to consider this year:
- Increase occupancy by targeting the market segments in growth mode and developing pricing strategies for each segment and booking channel.
- Continue to practise rate discipline, avoiding discounting when demand is strong. Protect rate positioning by limiting discounting to opaque channels and packages and fencing rates for price-sensitive groups.
- Maintain rate parity across booking channels, promoting your best-rate guarantee on brand.com to capture more direct bookings.
- Sell more premium room inventory through promotions and upsell programs.
- Generate incremental revenue through sales of food & beverage, spa, retail, parking, and ancillary products and services.
- Maintain a guest-centric marketing strategy, utilising a centralised guest data management platform to send targeted offers and communications to increase total spending and build loyalty.
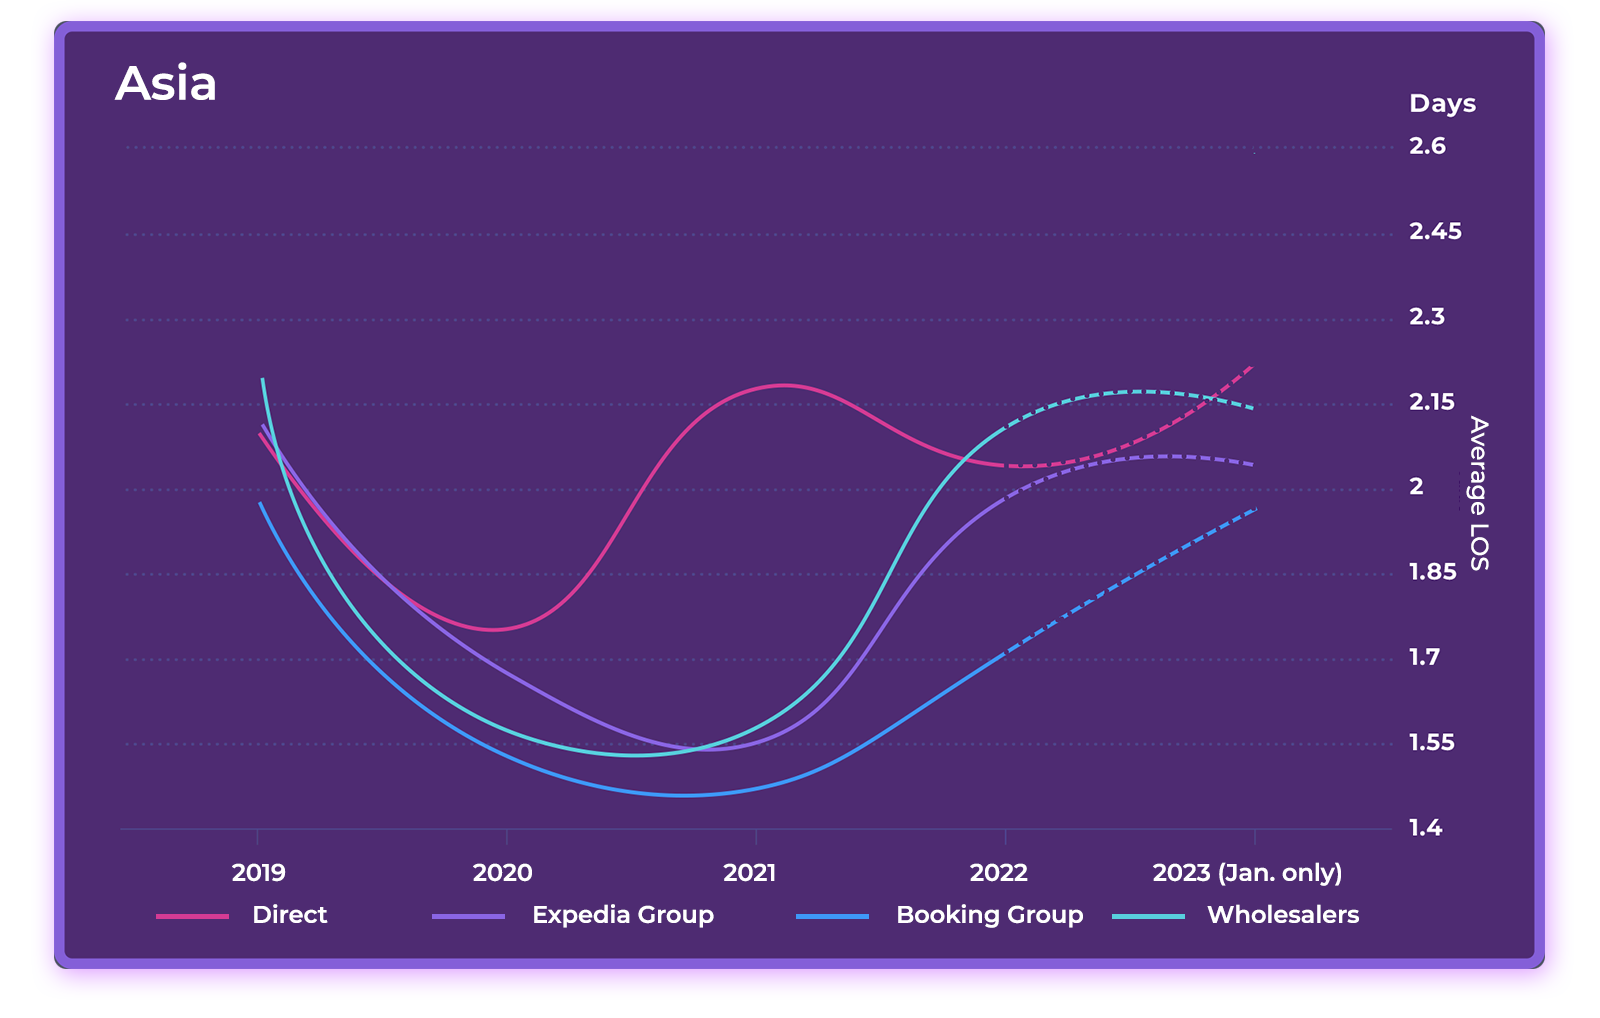
Length of Stay: back to pre-pandemic levels (and then some)
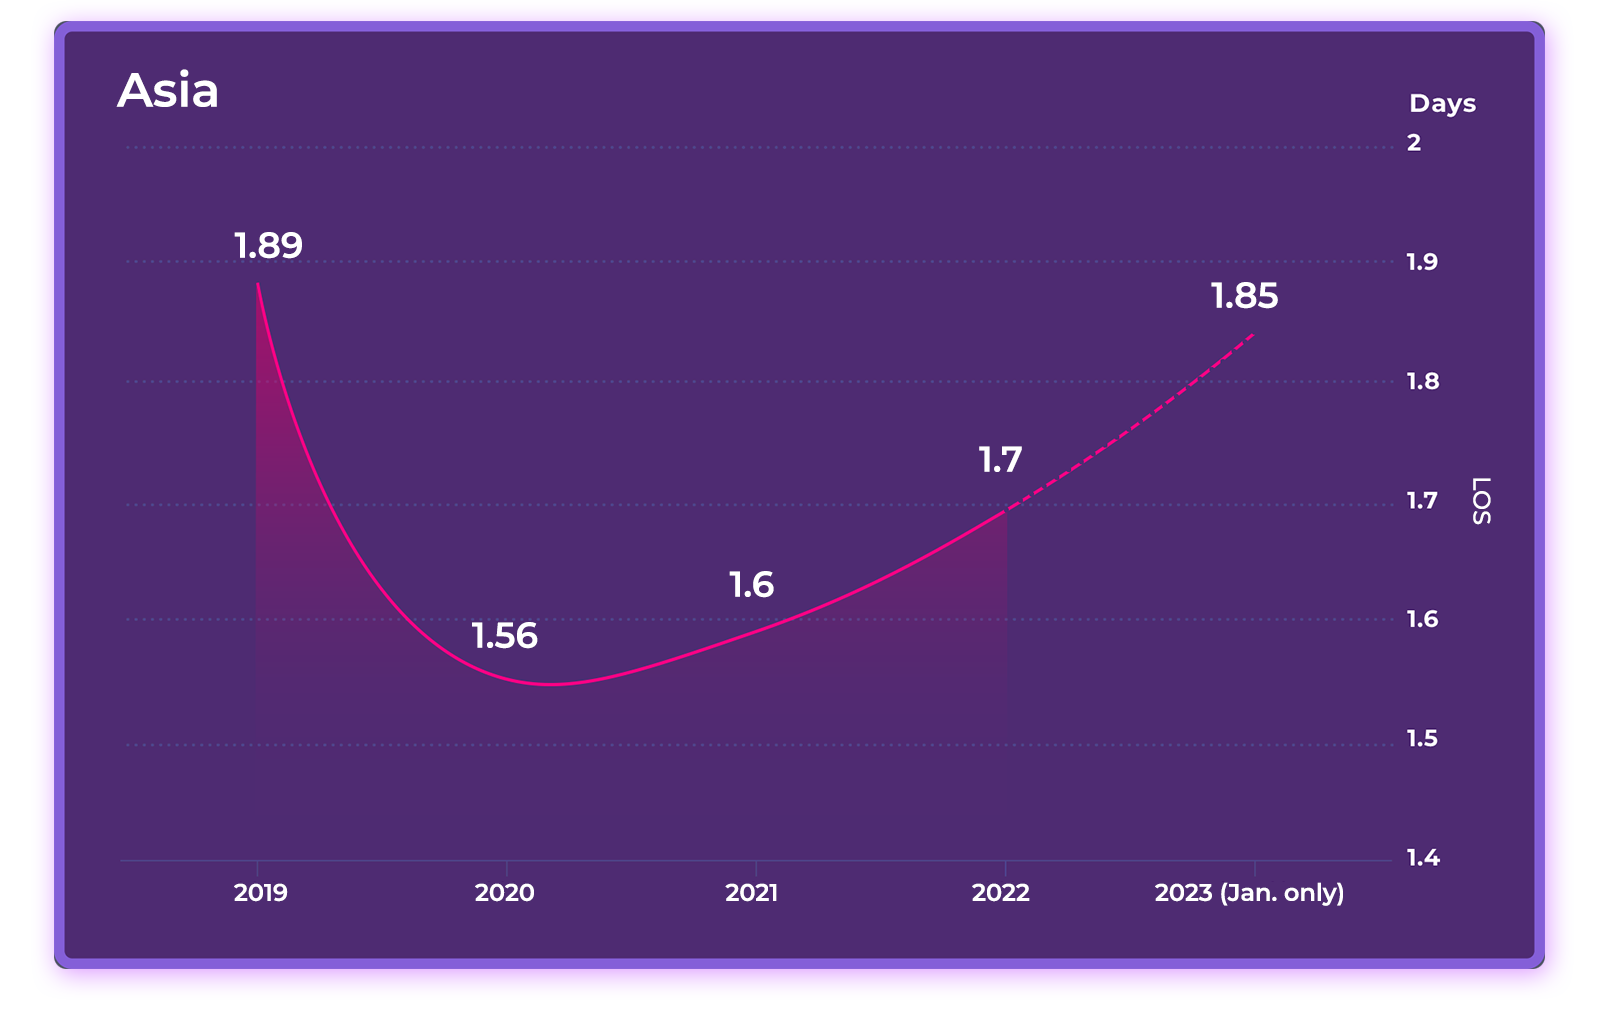
Average Length of Stay (ALOS) in days
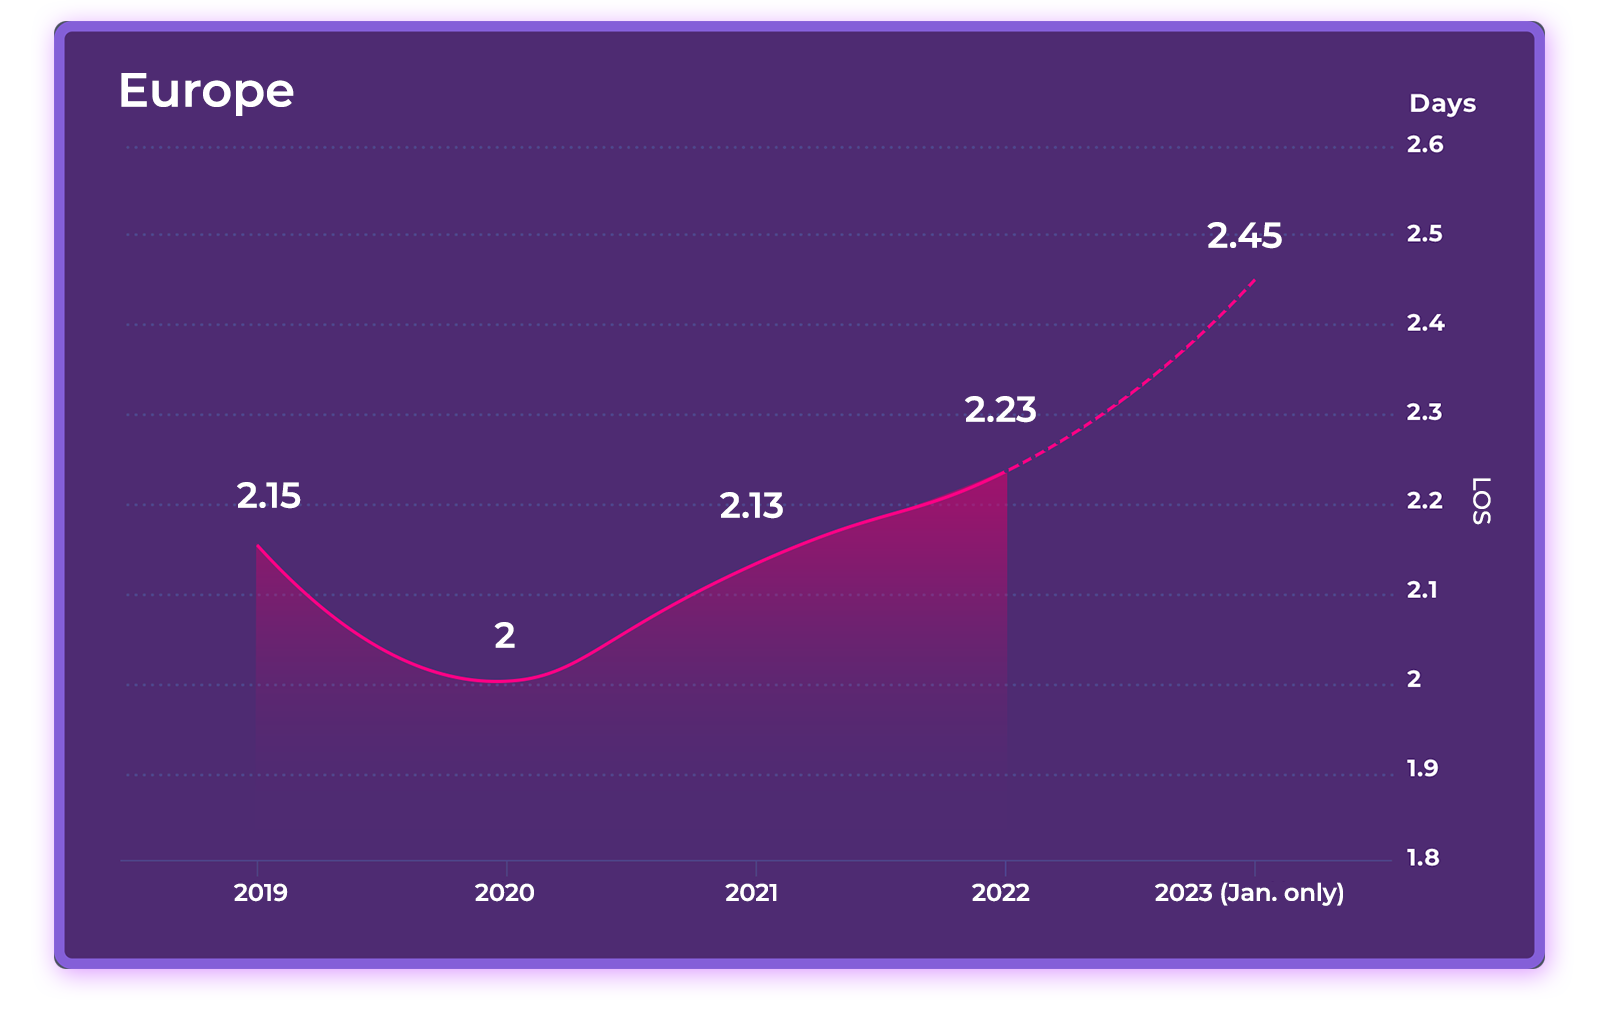
After the pandemic struck, the average length of stay (ALOS) fell slightly as travel patterns shifted from international to local and domestic travellers. In Europe, ALOS returned to 2019 levels in 2021 and then surpassed them in 2022, as more people took long-delayed vacations and international travel picked up.
In Asia, ALOS patterns followed a similar trajectory, although in 2022 they had yet to recover to pre-pandemic levels. Notably, ALOS was generally about a half-day shorter in Asia compared to Europe in all four years of the study.
In January 2023, ALOS continued to grow, reaching a four-year high of 2.45 days in Europe and falling just short of 2019 numbers in Asia.
Average Length of Stay (ALOS) in days by Online Sales Channel
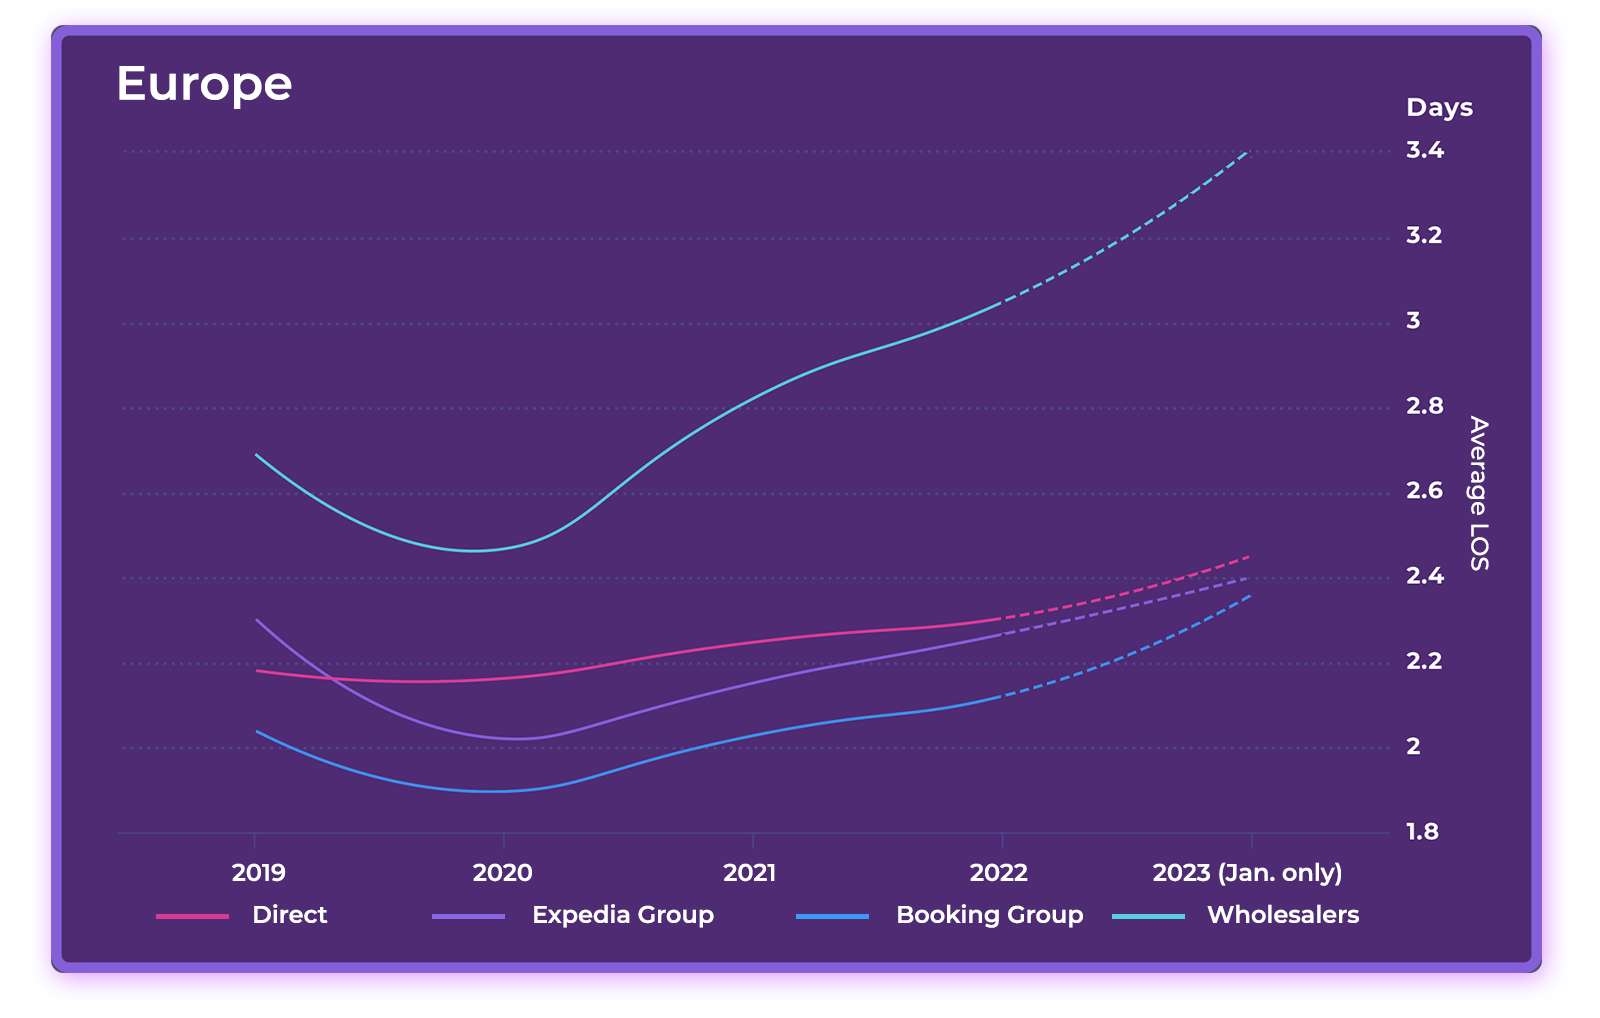
Breaking down ALOS by booking channel, we see that the wholesale channel had a significantly longer average length of stay than other channels in Europe, whereas bookings from Booking.com had the lowest length of stay. This pattern was consistent from 2019 through 2022.
In Asia, web direct had the highest ALOS in 2020 and 2021 but was surpassed slightly by wholesale business in 2022, only to regain the top position in January 2023. Booking.com had the lowest ALOS in all four years.
2023 Marketing & Revenue Strategies: Target Blended Travelers
In 2023, the shift from domestic to long-haul, international travellers should automatically push up average length of stay. Another way to increase ALOS—and, in turn, average booking value—is to target the rapidly growing segment of blended travellers. Blended travel, which includes bleisure travel, workcations and flexcations, is the combining leisure and business activities on the same trip.
The “work from anywhere” trend is changing travel patterns by enabling remote and hybrid workers to extend vacations and weekend getaways to work remotely. According to Expedia, usage of its “business-friendly” accommodation filter increased by triple digits in Q4 2022 year-over-year.
To target these travellers, hotels should highlight services and amenities that appeal to guests who work and play on property. This includes extra workspace, coworking facilities and in-room technology and refrigerators. Special long-stay rates and offers such as “stay five nights, pay for four” will also help attract these travellers.
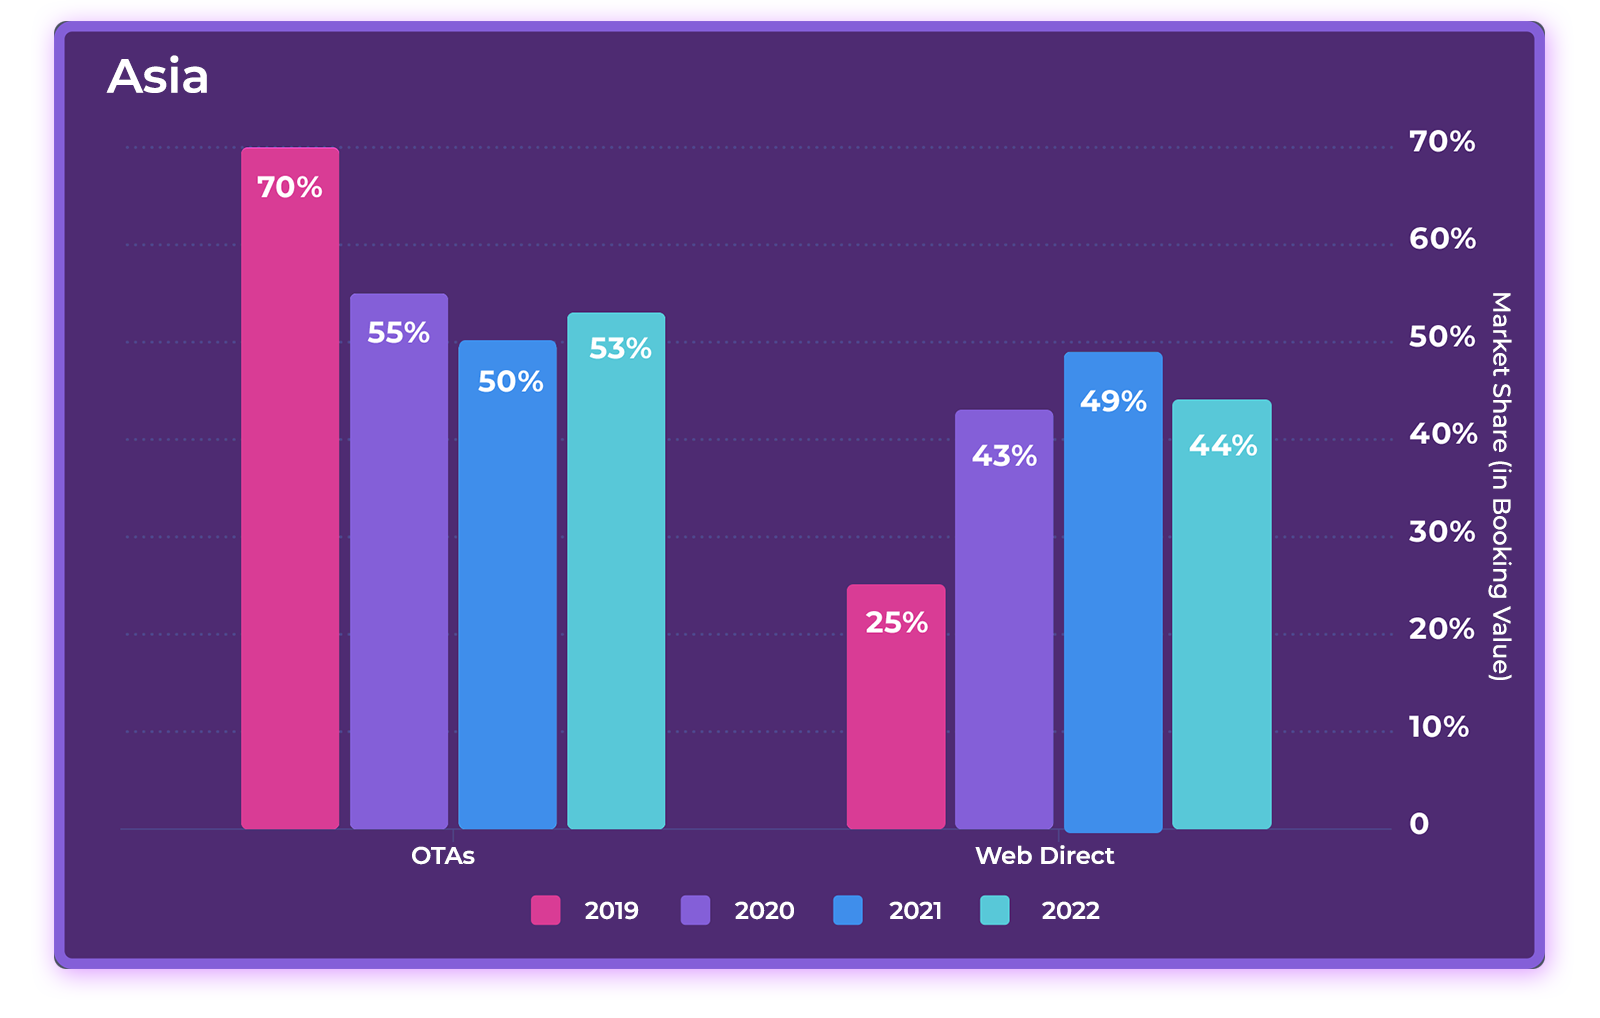
Channel Market Share: Hotels Increased Direct Bookings Relative to OTAs—but Can They Hold It?
OTAs vs. Direct Market Share in Gross Booking Value
During the pandemic, hotels benefitted from a substantial shift in traveller booking behaviour from OTAs to direct bookings, many of which came from domestic travellers.
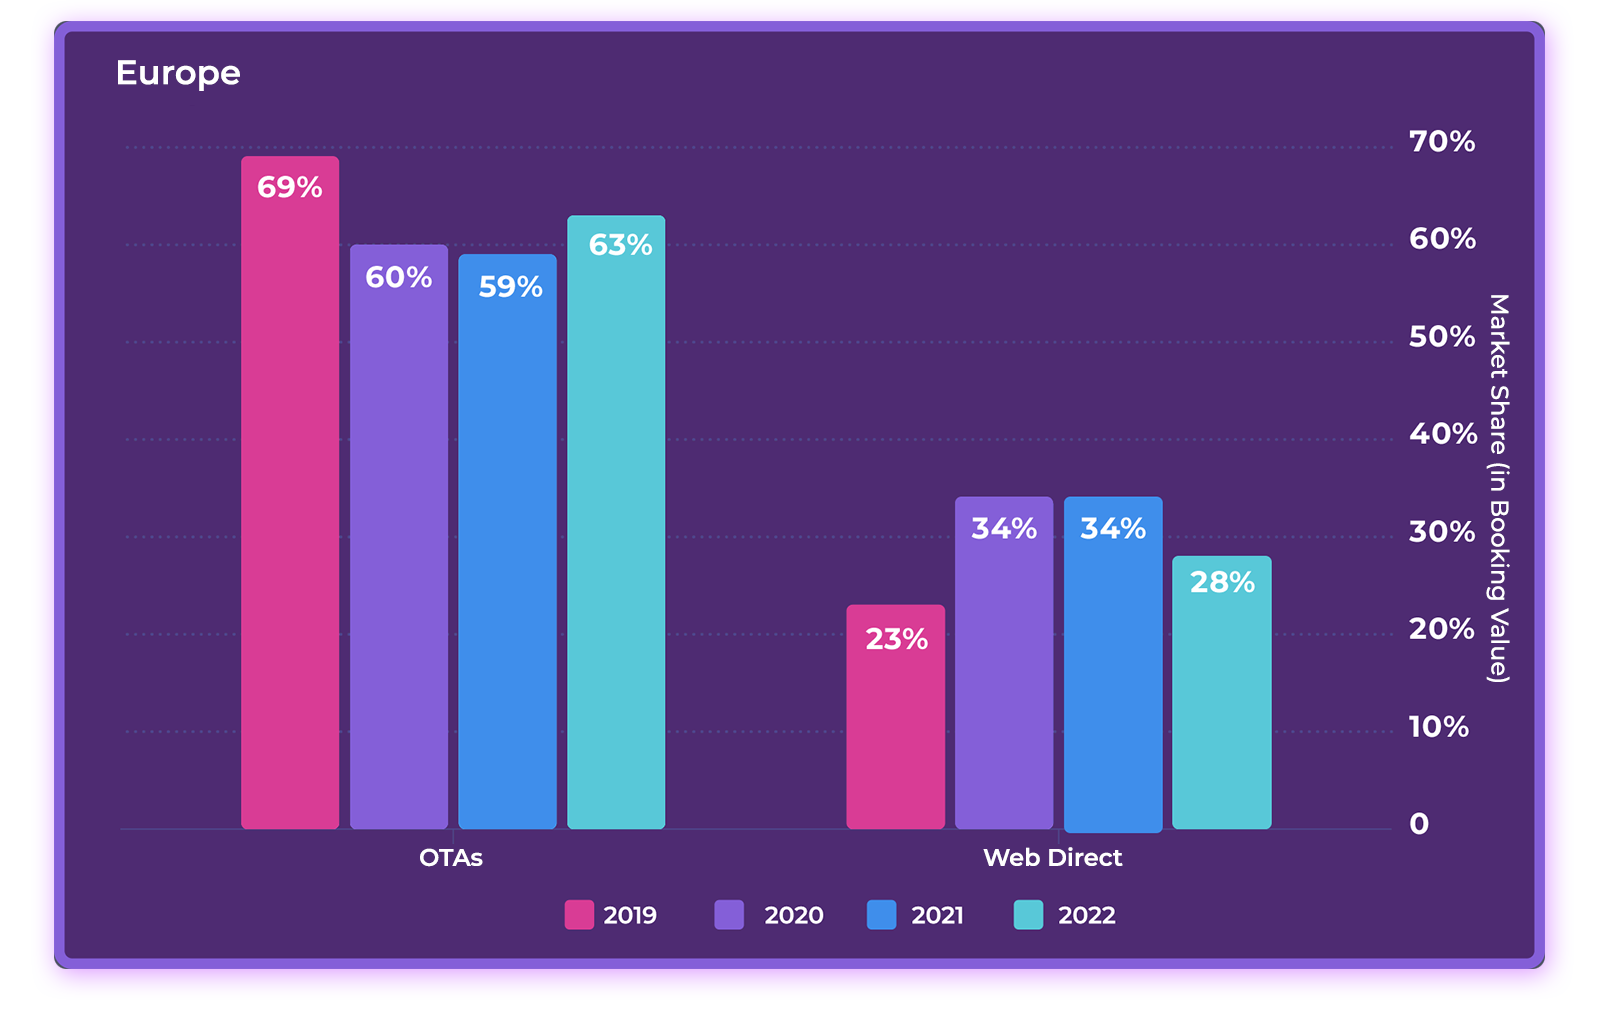
In Europe, hotels in our data set increased direct booking revenue by 11 points in 2022 relative to 2019, generating 34% of total online booking revenue from web direct. While hotels lost some ground in 2022, revenue from direct bookings was still 5 points ahead of 2019 volume.
In Asia, the shift was even more dramatic. Hotels increased their share of revenue from direct bookings by 18 points from 2019 to 2020 and by an additional 6 points in 2021, reaching near equity with OTAs. In 2022, direct market share fell slightly to 44% but was still 19 points above 2019.
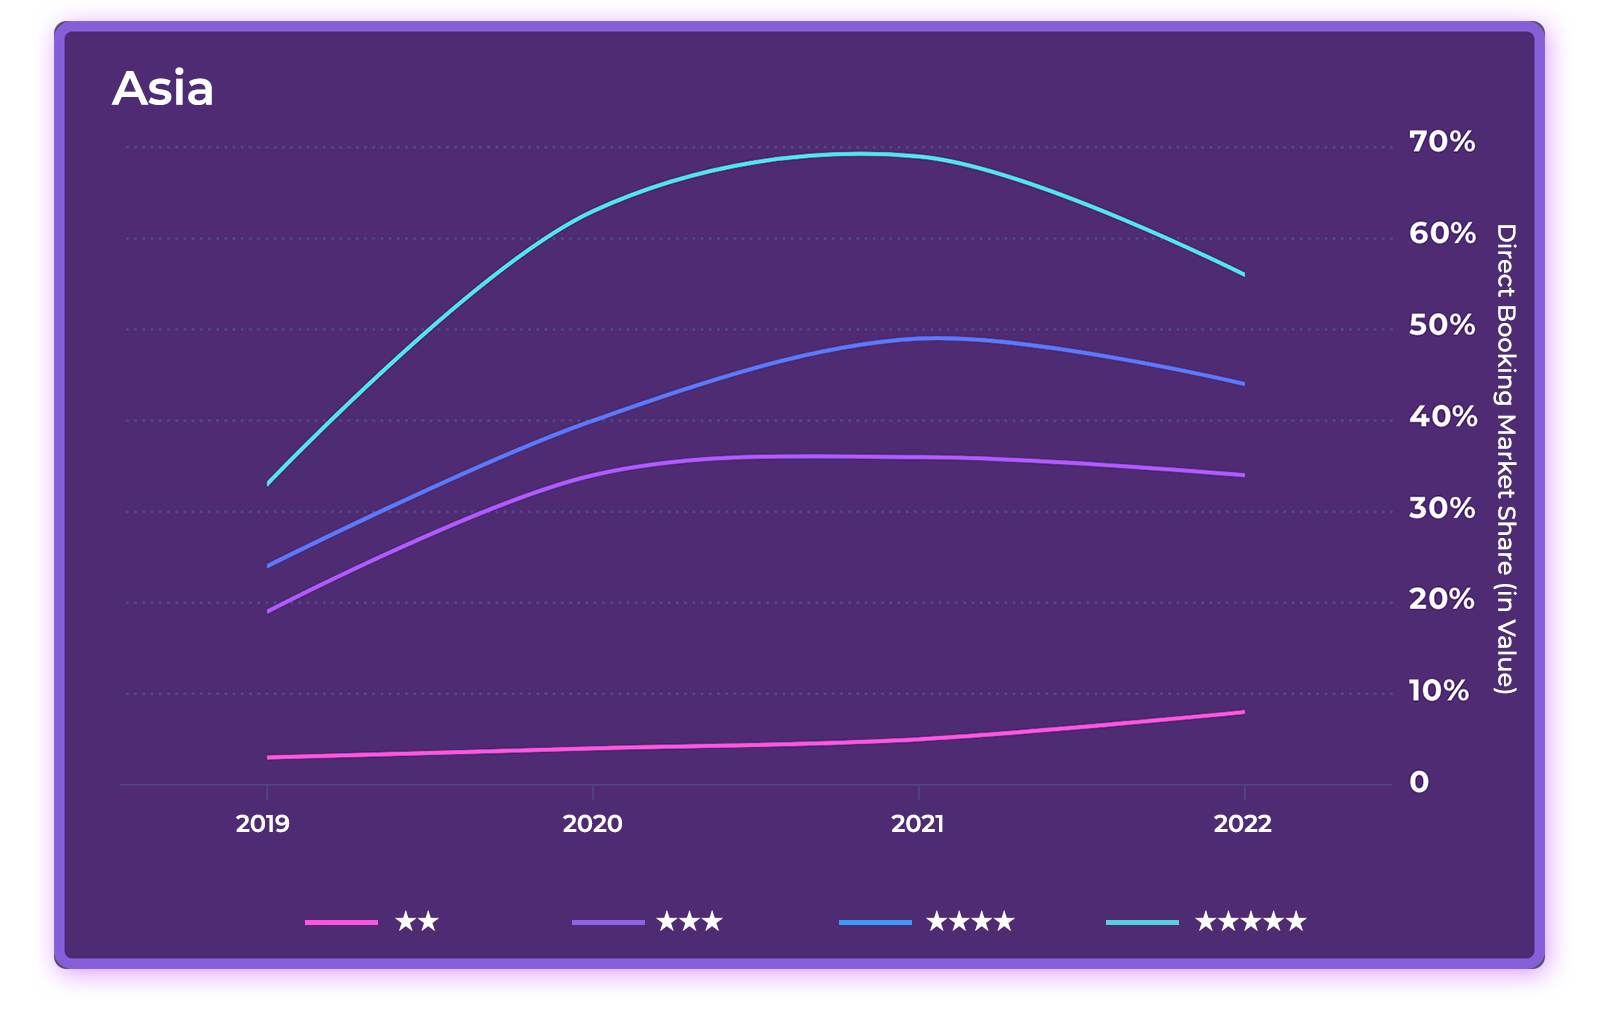
The share of direct distribution - in gross booking value - by hotel category
Breaking down performance by hotel categories, we see that the higher the category, the greater the market share of direct booking revenue.
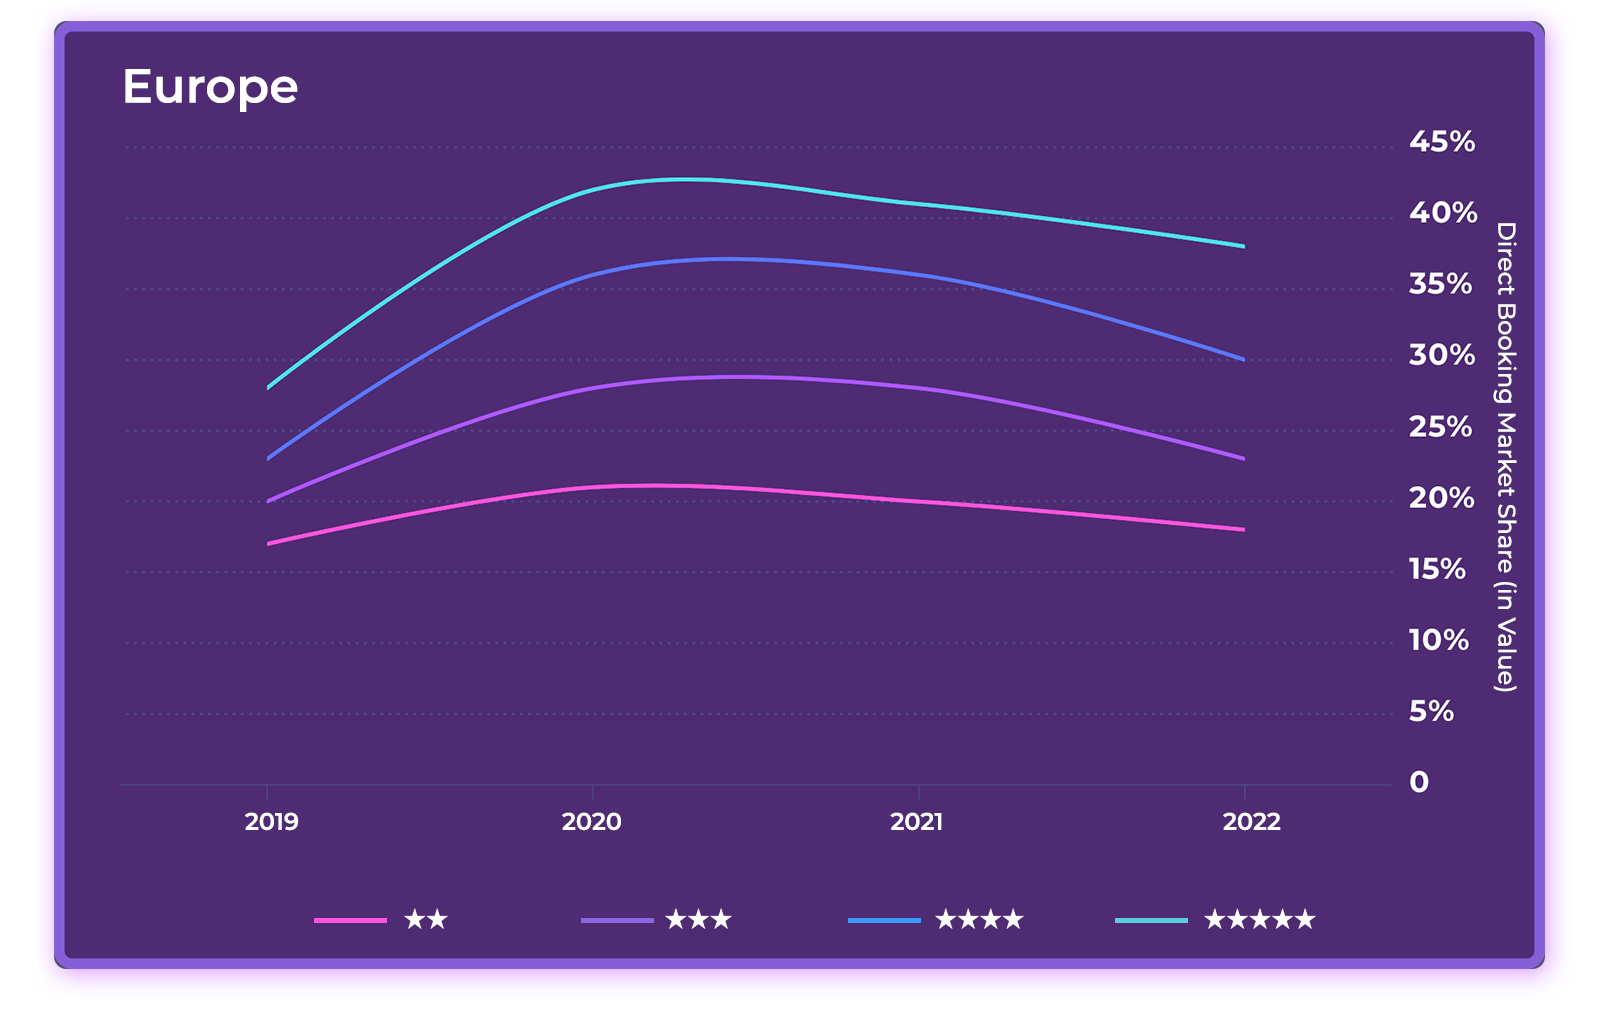
In Europe, 2-star hotels generated just under 20% of online revenue from direct bookings, whereas 5-star hotels generated almost 40%.
In Asia, the gap among hotel segments was even wider, with 2-star hotels generating less than 10% of online revenue from direct bookings and 5-star hotels generating over 50%.
2023 Marketing & Revenue Strategies: Don’t Let Those Direct Bookings Slip Away
We know that direct bookings are generally more profitable than OTA bookings due to lower acquisition costs, but our data also tells us that direct bookings generate more revenue per booking, longer lengths of stay and (as we’ll see shortly) lower cancellation rates.
However, previous gains in direct market share slipped in Europe in 2022 and threaten to do the same in Asia in 2023. How can hotels maintain direct market share in 2023—and even increase it? This takes us back to the fundamentals of direct-booking strategy.
- Whip your website, booking engine and SEO practices into shape to capture more organic traffic and convert more hotel website visitors to direct bookers.
- Protect your brand by bidding on your brand name keywords in Google Ads to prevent OTAs from diverting traffic away from your website.
- Ensure direct bookings always receive the best rates and most favourable booking conditions—and make that message prominent on your website.
- Provide a simple and seamless payment experience on your booking engine to reduce cart abandonment and increase conversion rates.
- Dedicate a proportion of marketing spend to attracting direct bookings, including search marketing, retargeting and social ad campaigns. Consider engaging an expert digital marketing agency to drive higher performance.
- Invest in metasearch. A recent study from D-EDGE found that hotels experienced an average increase of 95% in revenue from Google metasearch from 2019 to 2022, with an average distribution cost of only 8 percent in 2022.
- Make it a goal to convert every OTA guest into a direct booker on their next stay.
Market Share by Online Sales Channel in Gross Booking Value
Breaking down online booking revenue by the top distribution channels, we see that in Europe, the vast majority of bookings came from two sources: Booking Holdings (including Booking.com and Agoda) and web direct.
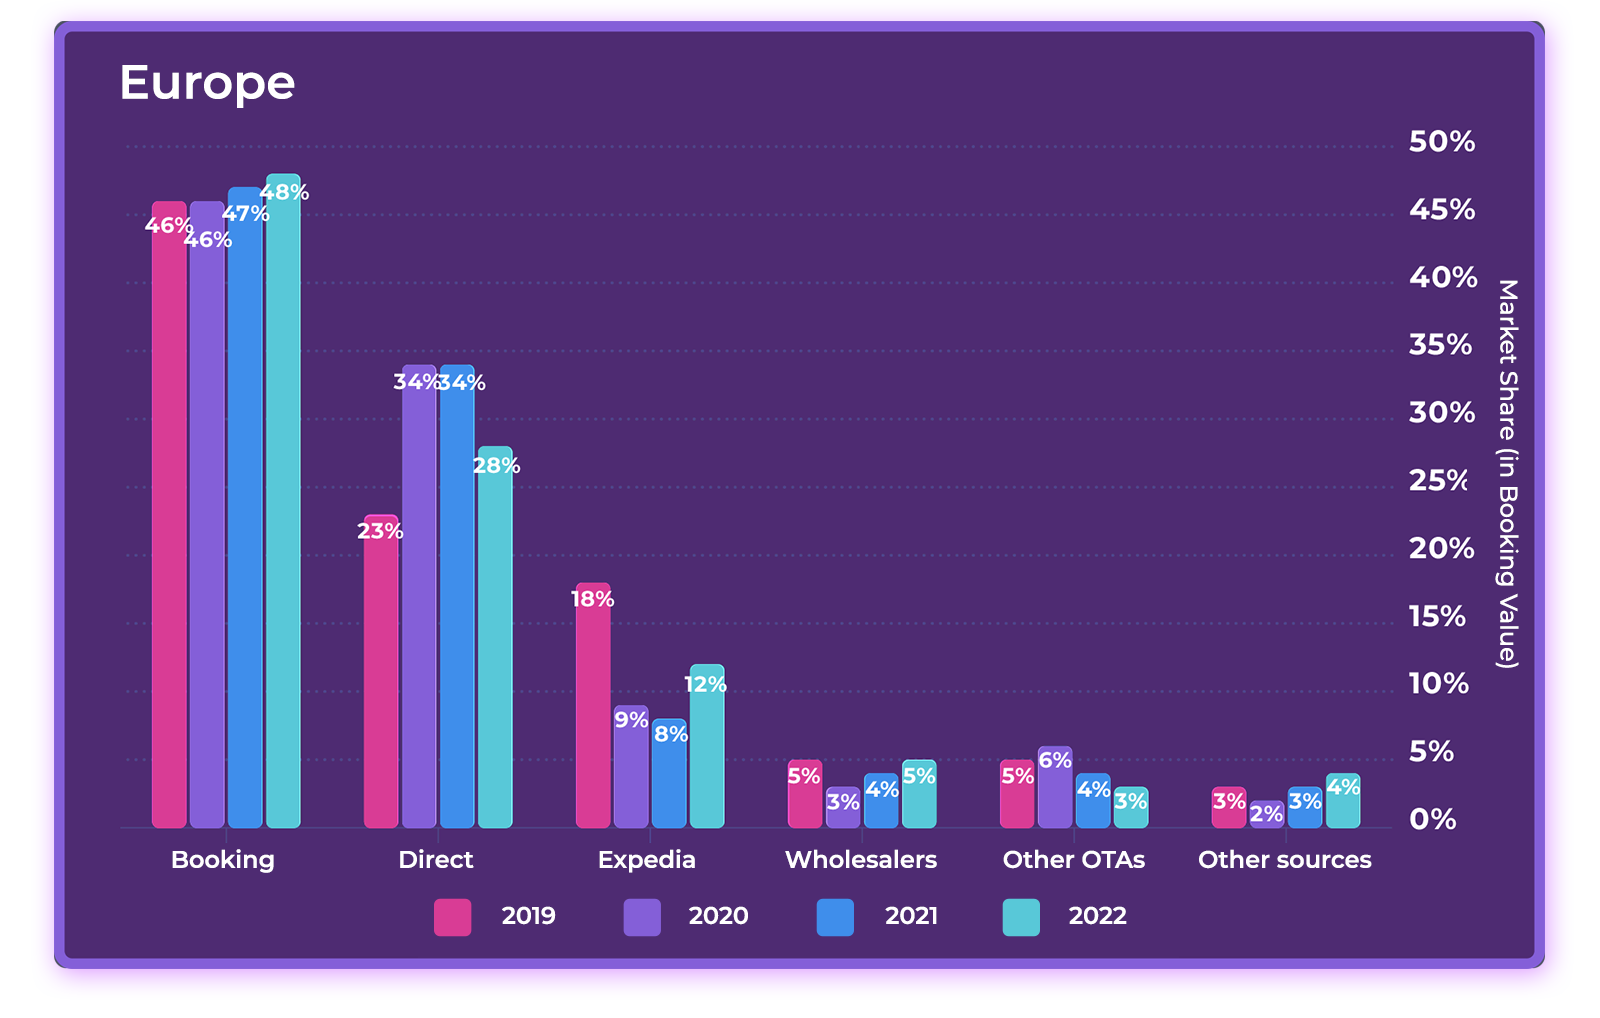
In 2022,Booking Holdings generated almost half of total revenue (48%), an increase of 2 points over 2019. Expedia Group generated 12%, 6 points less than in 2019. Other OTAs represented 3%, and wholesalers represented 5%.
In Asia, Booking.com represented a much lower market share of booking revenue compared to Europe, at 18% in 2022, 3 points down from 2019.
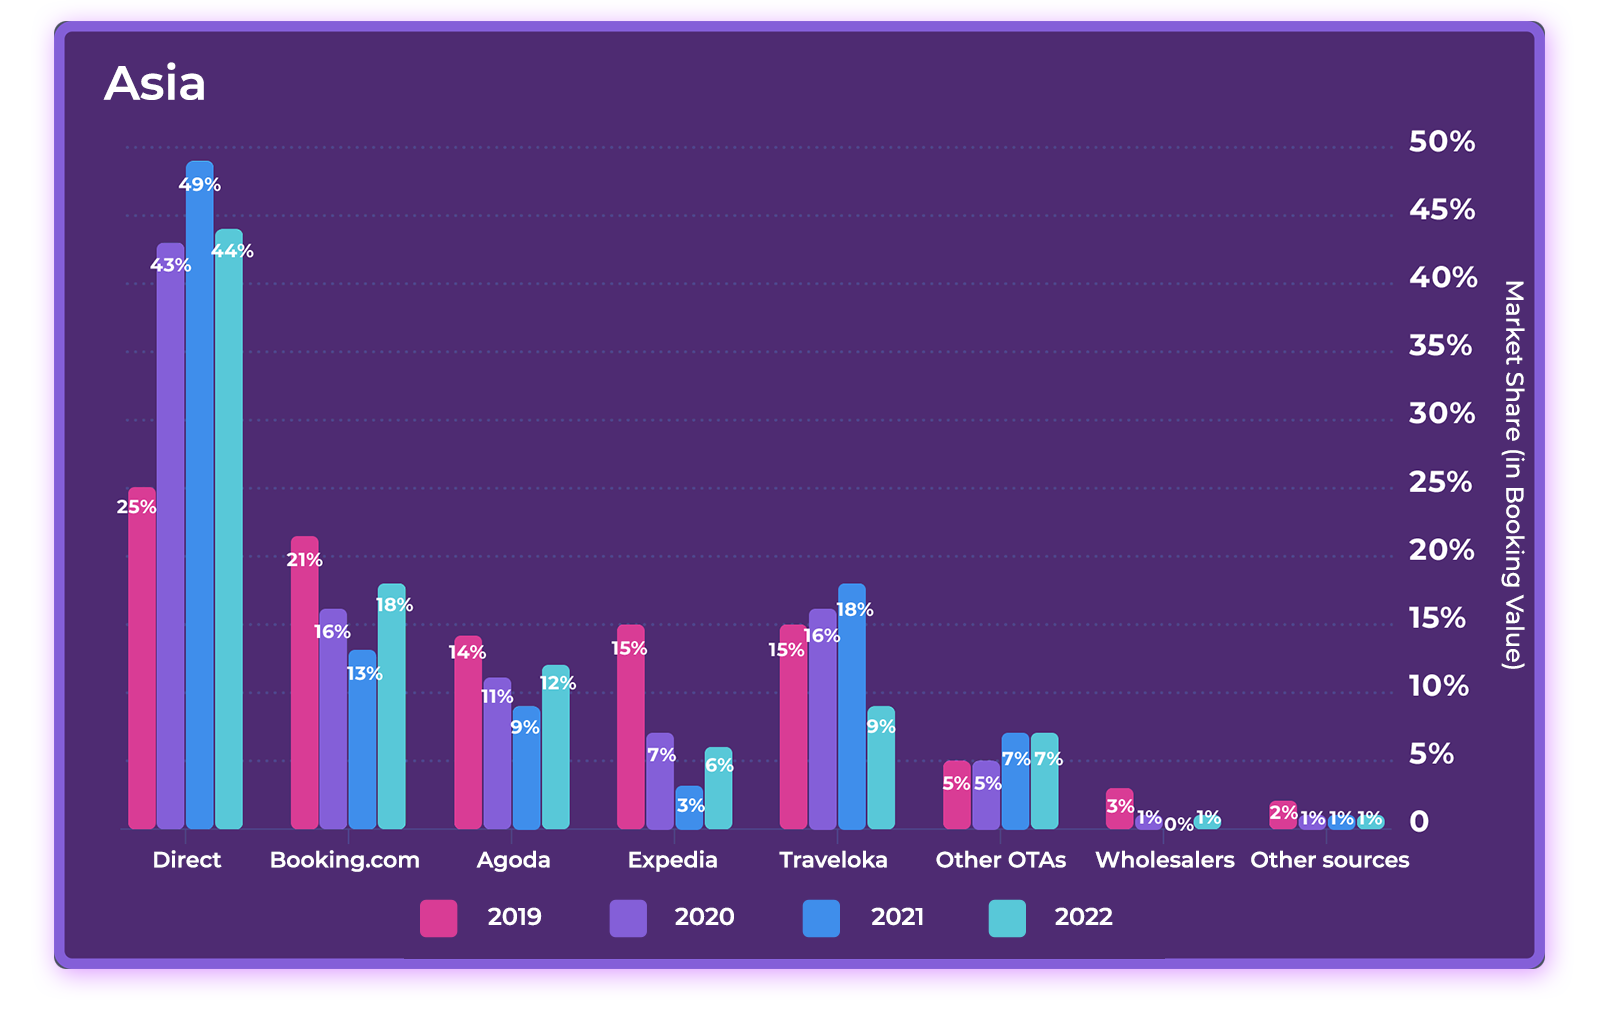
Here, Agoda (owned by Booking.com) is very popular, representing 12% of market share in 2022, 2 points less than 2019. Traveloka Group is also popular in the region, generating 9% of revenue in 2022, a decrease of 6 points from 2019. As in Europe, Expedia lost significant market share, generating only 6% of revenue in 2022 in Asia, 9 points down from 2019. Other OTAs generated 7%, and wholesalers represented only 1%.
2023 Marketing & Revenue Strategies: Take Control of OTA Business
With international travel in growth mode, the pendulum is swinging back in favour of OTAs. During the pandemic, it was a free-for-all as hotels pursued any type of business they could get. Now it’s time to be more strategic and targeted, focusing on the most profitable channels.
In addition to the direct booking strategies mentioned above, here are some distribution strategies to consider:
- Maintain a balanced multichannel strategy, targeting bookings from the entire distribution value chain, including direct, OTAs, wholesale, travel agencies and tour companies.
- Target travel agency and corporate business via the GDS. Ask your technology provider about direct connectivity to GDS platforms, enabling you to manage pricing and availability via your channel manager.
- Be careful not to become overly dependent on one OTA (ahem, Booking.com). Pursue a diverse strategy that also includes smaller, regional players such as Traveloka, Tiket, PegiPegi, MGholiday in Asia or Szallas and Slevomat in Eastern Europe and specialty OTAs such as VeryChic for example. Look also for fast growing newcomers such as Hopper, one of the most downloaded OTA App in the U.S. in 2021. Check here all OTAs available on D-EDGE Channel Manager.
.
- Expedia was down, but it’s far from out. Expect bookings to grow as international long-haul travel returns—particularly from Americans, who typically show a preference for Expedia Group sites.
- Don’t allow OTAs to undercut your rates or offer more flexible cancellation policies. Always match or beat OTA pricing and booking conditions, including offering refundable rates, flexible cancellations and payment policies, and special rates for loyalty members and mobile bookings.
- Be careful not to participate in so many OTA promotions that the commission add-ons and rate discounts erode your profitability. Compare costs of acquisition and profitability on every channel.
- Consider working with Airbnb if you aren’t doing so already. In 2022, Airbnb showed the strongest growth of all major channels among hotels in our European data set.
- Covet your loyal guests. With Expedia’s One Key program launching this year and Booking.com snapping up bookings with Genius discounts, hotels must remember that true loyalty isn’t bought, it’s earned—through recognition, preferred rates, preferential treatment and rewards.
- Track booking data closely, using it to understand and influence guest behaviour with loyalty incentives, marketing programs and direct booking campaigns.
Cancellation Rate: Numbers Return to Pre-pandemic Levels but Are Still Too High
Cancellation Rates
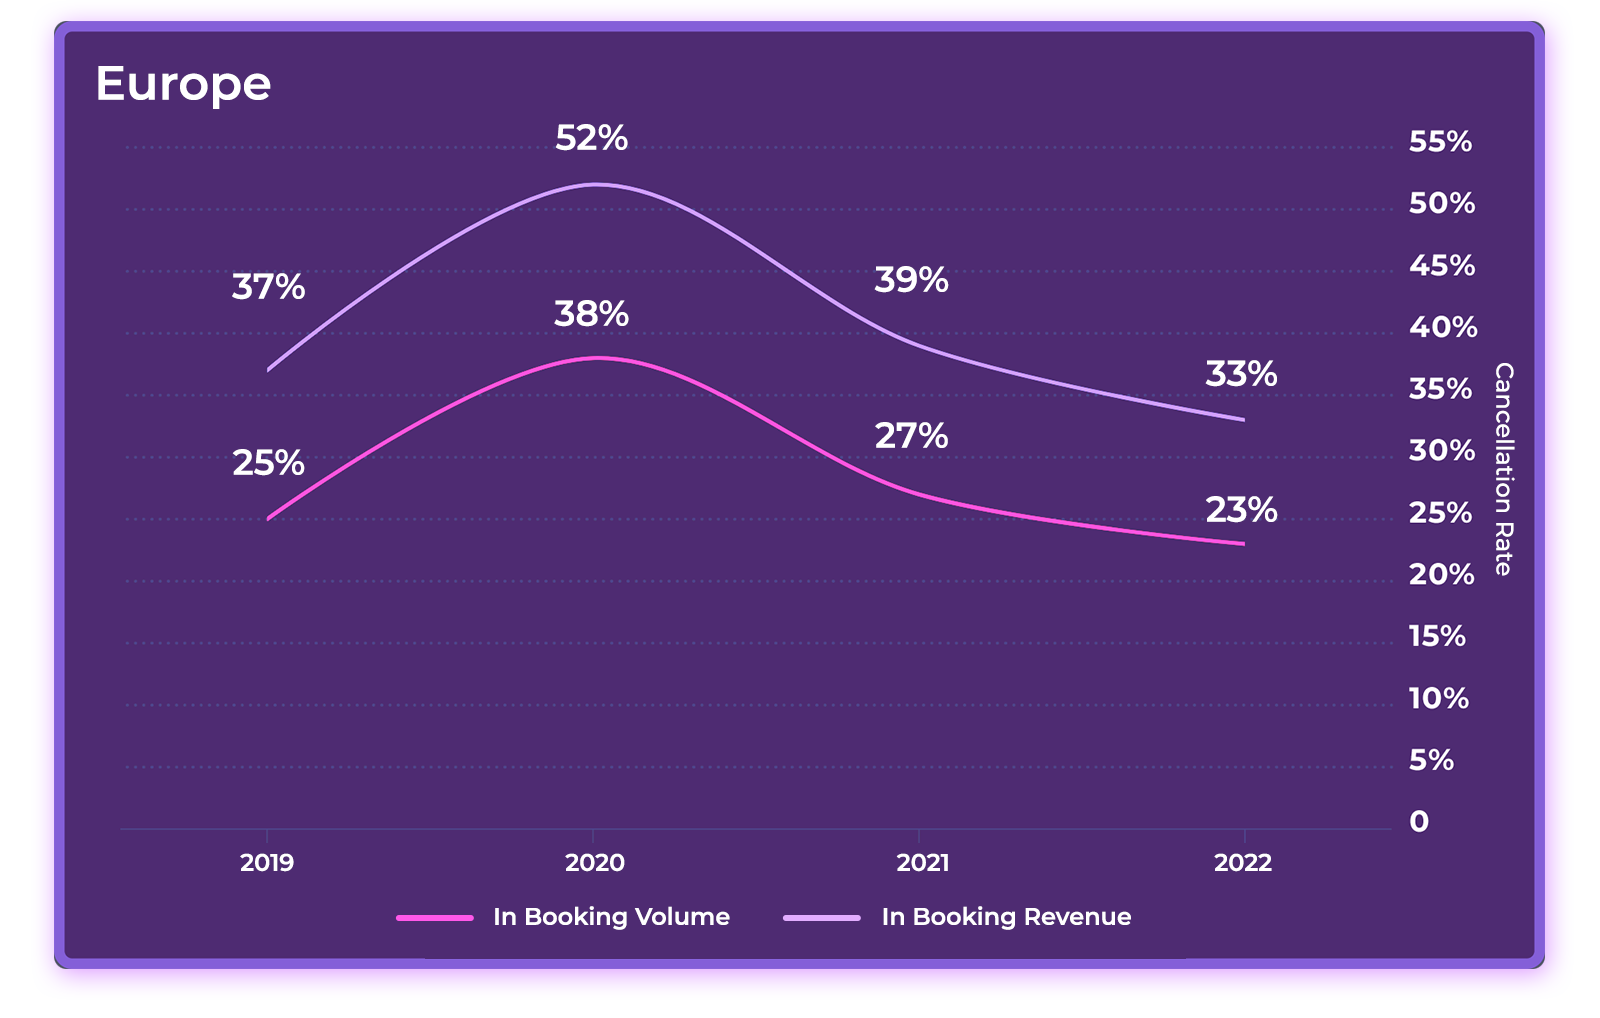

During the pandemic, cancellation rates surged, especially in Europe, where they reached 52%. This made managing inventory and forecasting accurately especially challenging for hotels. In 2022, cancellations returned to normal in Europe, even dipping below 2019 numbers. In Asia, however, cancellation rates have yet to return to pre-pandemic levels.
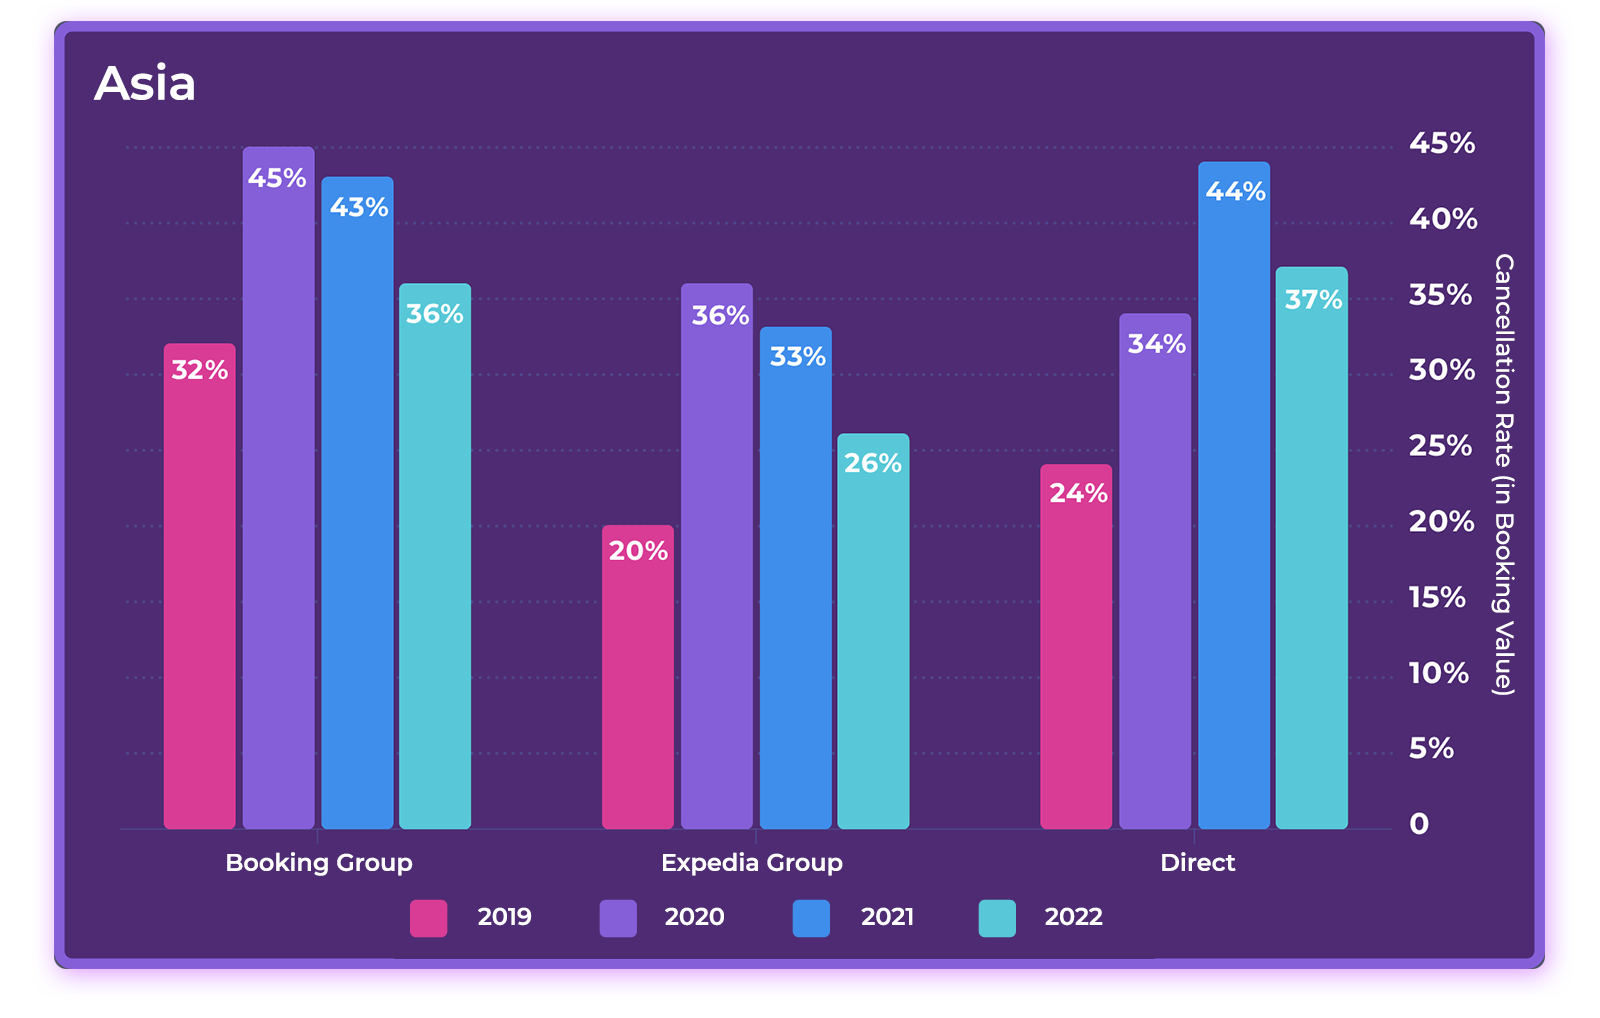
Cancellation Rates by Online Sale Channel
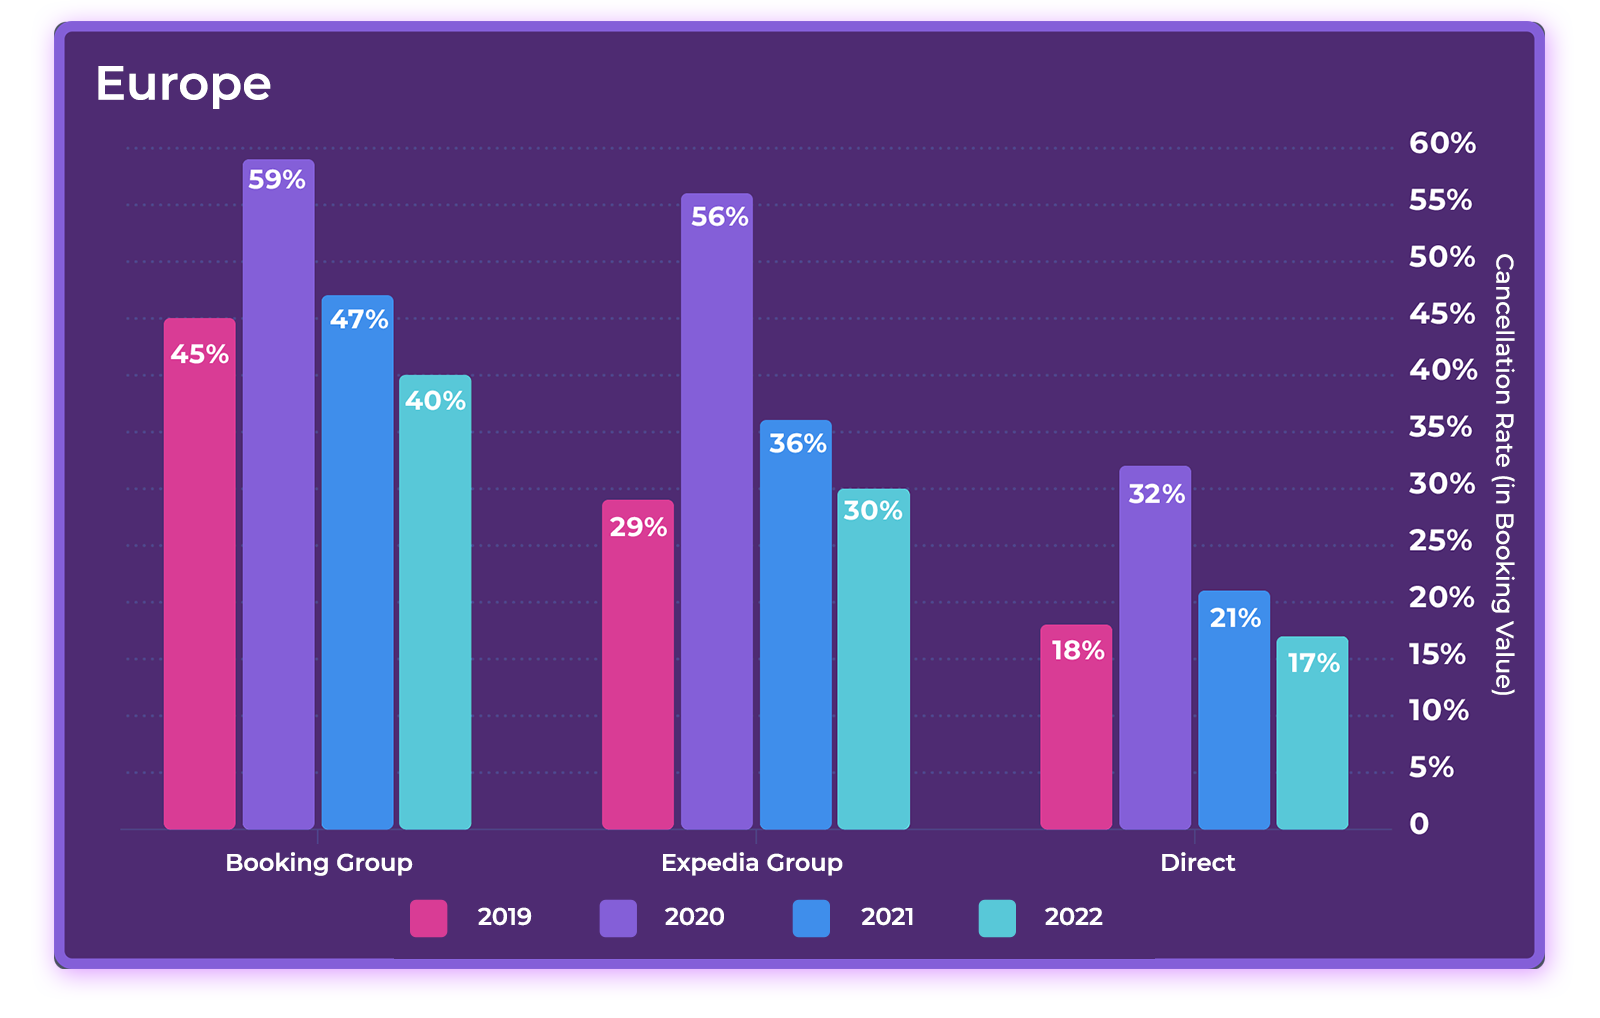
Breaking down cancellation rates by booking channel, we see that the main culprits in Europe are OTAs. After peaking in 2020 at 59% of revenue, Booking Holdings’ cancellation rate fell to 40% in 2022. Meanwhile, Expedia’s cancellation rate surged to 56% in 2020 and fell to 30% in 2022. By comparison, only 17% of direct booking revenue was cancelled in 2022.
In Asia, OTA cancellation rates were slightly lower than those in Europe, with 36% of revenue from Booking Holdings cancelled in 2022 and 26% of revenue from Expedia Group cancelled. However, what is most surprising is the high cancellation rate for direct bookings in the region, at 37% of revenue in 2022, an increase of 13 points relative to 2019.
2023 Marketing & Revenue Strategies: Reduce Cancellation Rates
Although cancellation rates have levelled off, at 33% of total revenue in Europe and 34% in Asia in 2022, there is not much to celebrate. In Europe, the low rate of cancellations from direct bookings relative to OTAs is another reason to make direct bookings a priority. In Asia, however, hotels need to analyse the reasons behind the high rate of cancellations from direct bookings and find ways to bring the numbers down.
During the pandemic, flexibility was a top priority for travellers. Now, hotels can afford to tighten up policies and place more emphasis on non-refundable rates. This will help you gain better control over inventory, forecast more accurately and prevent last-minute cancellations and “trip stacking”—travellers booking multiple hotels and then cancelling at the last minute. An online payment solution will help automate authorisations and payment processing, reducing cancellations, refunds and chargebacks.
Lead Time: Long-range Trip Planning Is Back
Average Lead Time (Days)
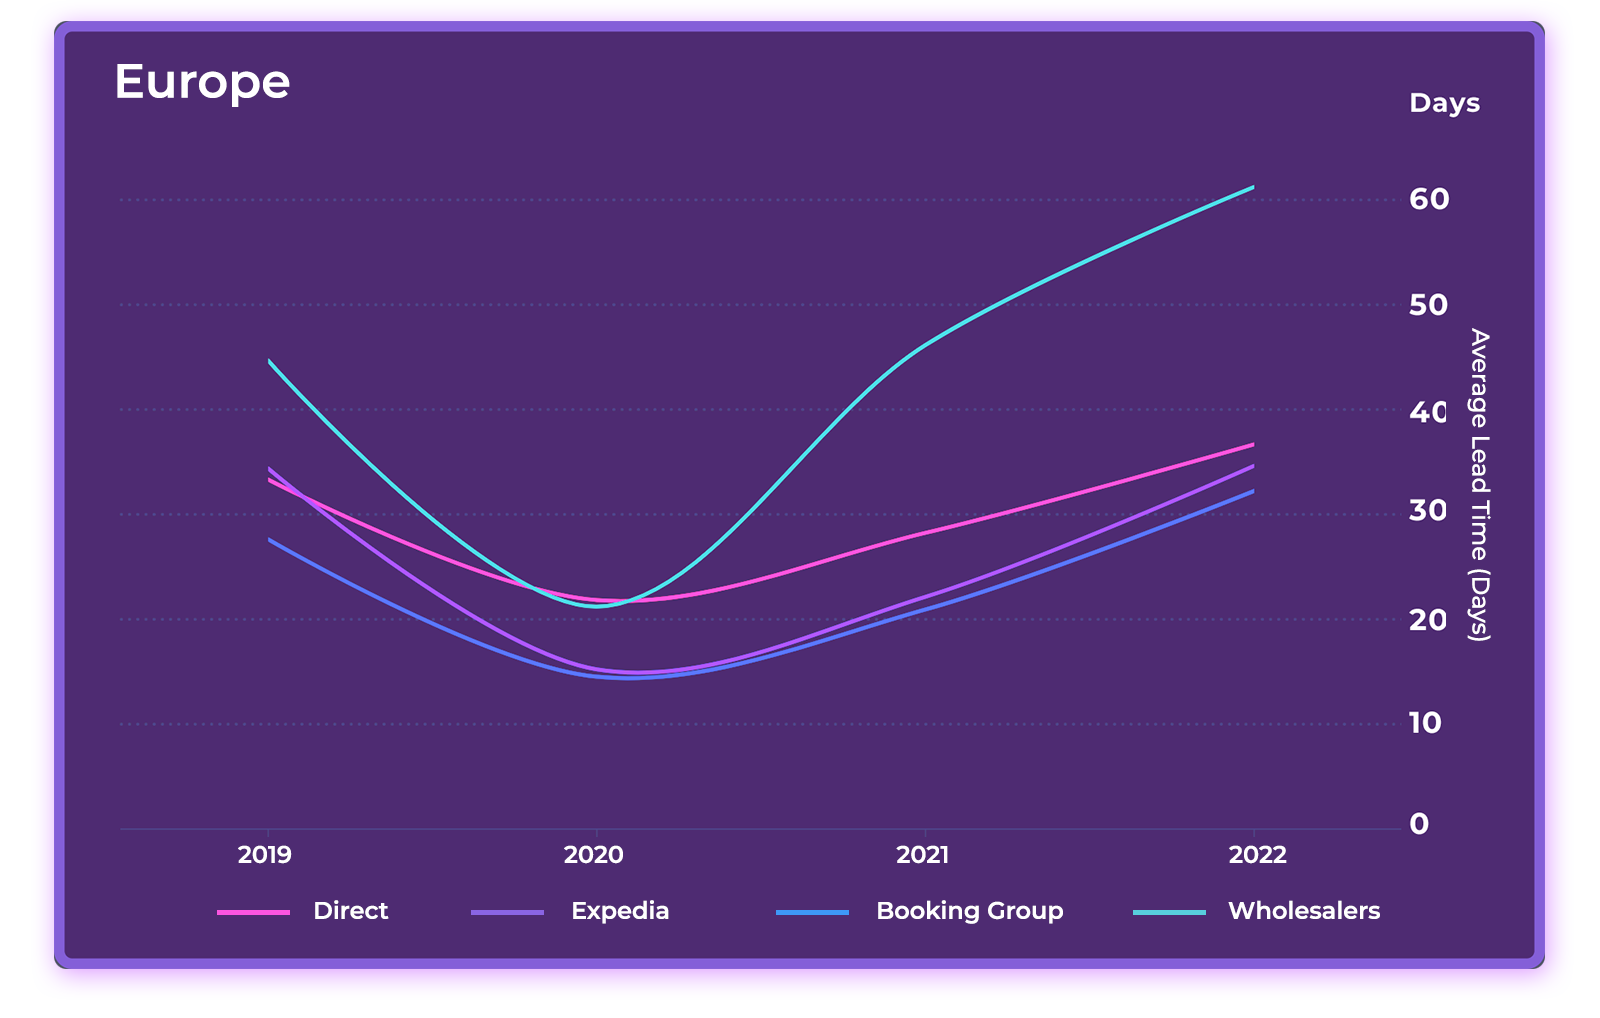
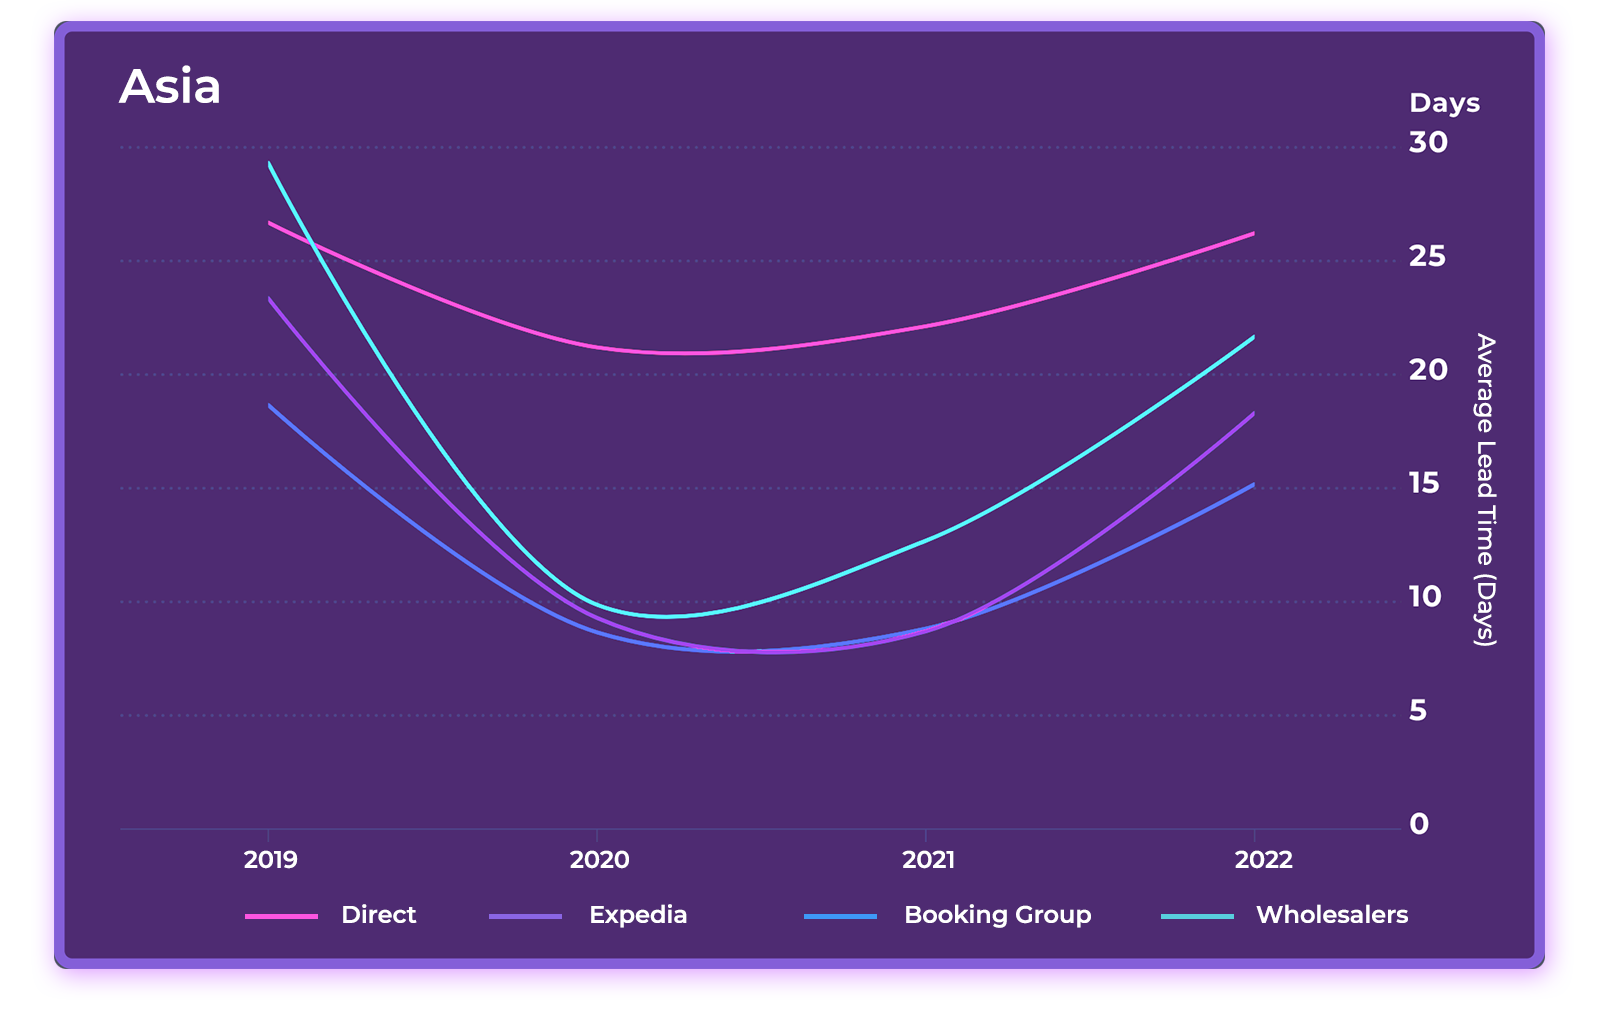
After dropping sharply in 2020, average lead times on all major booking channels rebounded in 2021 and 2022. In Europe, lead times surpassed 2019 levels. On both continents, direct bookings had the longest lead times and bookings from Booking Holdings sites had the shortest.
2023 Marketing & Revenue Strategies: Incentivise Longer Lead Times
Longer lead times provide one more compelling reason for hoteliers to prioritise direct bookings over OTA bookings. Hoteliers can expect longer lead times in 2023 as more international travellers take to the road. Offering discounts and incentives for advanced bookings will help provide a base upon which higher-rated business can be built. The same goes for group bookings, which generally book further in advance than individual travellers.
Positioning Your Property for Growth
Overall, the outlook for 2023 looks promising, but growth patterns remain uncertain. Hoteliers who put into place the right technology, data and expertise will come out on top in any market conditions.
As travel planning continues to shift online, this means adapting digital marketing strategies to reflect today’s multichannel booking patterns. It also means investing in a high-performance Central Reservation System (CRS) with an integrated booking engine, channel manager and online payment solution and connectivity to the PMS and other core technology.
As for independent hotels and small groups, you will be well positioned to outperform big-brand competitors in 2023 by staying agile, paying close attention to booking behaviour, and quickly shifting resources to where opportunities lie.
Methodology
Data Set
- 4,594 properties in Europe and 524 properties in Asia (excluding mainland China) comprising independent hotels and small to medium-sized hotel groups.
- Reservation data recorded from D-EDGE’s Central Reservation System (CRS) using a constant sample of D-EDGE hotel clients over four years, from January 1, 2019, through December 31, 2022.
- Bookings were made through more than 200 online channels, including hotel booking engines, online travel agencies, tour operators, consolidators and tourist office websites. Offline bookings by telephone, email, walk-ins, etc. were not included.
EUROPE
Number of Hotels in the research panel
4,594
Main Countries
France (2,797), Italy (182), Portugal (348), Spain (138), UK (85), Eastern Europe (462)
Hotel Categories
2* 6%
3* 35%
4* 37%
5* 7%
NC 14%
ASIA
Number of Hotels in the research panel
524
Main Countries
Indonesia (169), Taiwan (79), Thailand (19), Malaysia (56), VT (48)
Hotel Categories
2* 7%
3* 23%
4* 47%
5* 16%
NC 7%
You may also like
Peak season is almost here, now is the time to refine your operations to ensure a seamless guest experience and hit your…